Wednesday May 18: Five things the markets are talking about
Recent data would suggest that the U.S. economy is stabilizing, despite the tough winter.
Reports released yesterday showed a pickup in U.S industrial output, continued momentum in the U.S housing sector and firming inflation, all point to stronger growth in Q2.
If we add this to mix of other recent data showing a rebound in U.S retail sales, rising consumer confidence and continued job gains would signify that fears of another U.S. recession or deflation have been beaten back for the time being.
Now all this market requires is the Fed and the investor to be reading from the same script. Will the market get a better understanding on Fed rate hike timing from today’s Federal Open Market Committee (FOMC) minutes?
1. U.S fed funds odds change
Yesterday’s April CPI inflation headline (+0.4% vs. +0.1% m/m) saw its biggest gain in three-years. The core was more muted, with the measure up +0.2% vs. +0.1% m/m.
Not surprisingly the recovery in energy prices was cited as a major factor in the non-core data. U.S gas prices rallied more than +8% last month, the largest gain in four-years.
Even April’s residential housing report was more upbeat. Housing starts beat expectations (+1.12m), but permits were a bit below estimates, although still up a robust +3.6% y/y.
Collectively, the reports have led to more volatility in interest rate expectations. Currently, fed fund futures are pricing in a +11% probability of a June rate hike, up from +4% on Monday, and a +66% chance of a rate increase by December, up from 59% on Monday.
Now that the market is being reminded from Fed officials that June is a “live” meet – will today’s FOMC minutes firm up the odds for a June hike?

2. Japan’s GDP tells a story
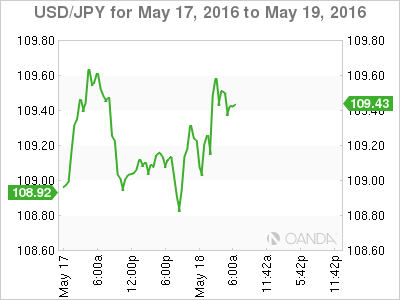
Japanese data overnight suggest that PM Abe’ government has avoided a “technical” recession.
Japan’s Q1 preliminary GDP beat expectations (Q/Q: +0.4% vs. +0.1%e vs. -0.3% prior; annualized GDP: +1.7% vs. +0.3%e)
Digging deeper, there is some telling signs in the components. Exports rose +0.6% after a -0.8% drop in Q4, and consumption was at a three-quarter high of +0.5%, above +0.2%e and up from -0.9% in Q4.
The negatives, recovery in CAPEX was “missing in action,” as non-residential investment was -1.4% vs. -0.8%e – the biggest decline since Q2 2015.
Japan’s Economic Minister Ishihara said the “economy continues its moderate recovery trend with a notable rebound in consumption, though slowing growth in China and emerging market volatility bear close watching.”
PM Abe’s advisor Hamada continues to recommend that the government should holds off on the sales tax hike plans, and also warned that an intervention on the currency could impact US/Japan ties. But, is anyone listening?
With the G7 meet just around the corner, expect currency manipulation to be mentioned – unofficially of course.

3. Eurozone slides back into deflation
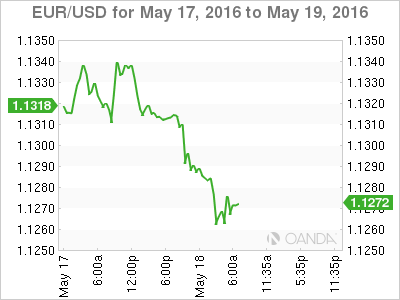
Euro data this morning indicates that the eurozone has slipped back into deflation in April and this despite stabilization in energy prices.
It’s not a surprise, but it will be a big blow to the ECB whose main focus is to boost consumer prices.
Preliminary estimates showed that y/y consumer prices were -0.2% below their levels in April – the second month so far this year.
Deflation will bring with it a new round of fresh worries for Euro policy makers.
For the past three-years the ECB has been pointing the finger at declining energy prices as being the main culprit for deflation, but energy prices have rebounded after sharp falls in the first two-months of the year, and indeed rose slightly last month.
Instead, the main driver of the drop in consumer prices is being attributed to the decline in the rate at which services prices rose – +0.9% from +1.4% in March.
Some analyst will blame the Easter holiday effect, but it most likely it will be attributed to businesses outside the energy sector cutting their prices to reflect lower costs or falling inflation expectations among consumers.
The core-rate of inflation fell to +0.7% from +1% in March – the lowest print this year.
4. Oil Prices retreat a tad
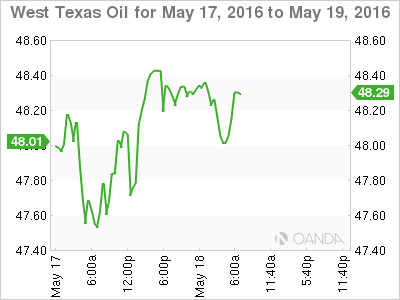
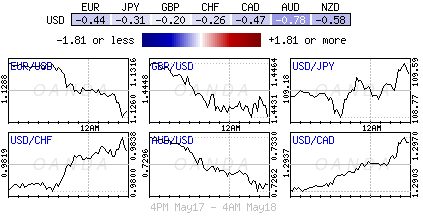
Crude oil prices have edged lower ahead of the U.S open, pushed down mostly by a stronger dollar. Investors are waiting for today’s all-important U.S. supply data to make their next move.
Despite the decline, Brent (-0.5% to $49.05) and WTI (-0.3% at $48.19) continue to hover near their respective month highs on production disruptions.
Traders are monitoring a number of event risks that are having a material impact on global supply. There is political upheaval in Venezuela as well as oil delta sabotage in Nigeria and wildfires in Canada.
Yesterday’s weekly API oil inventories revealed the first draw in three week’s (-1.1m vs. +3.4m prior). Currently, the market expects today’s EIA report for last week to show a decrease of -2.4m barrels.

5. Euro indices see red
European equity indices are trading generally lower across the board aided by lower oil prices ahead of the U.S open.
It seems that investors are content to take some profit off the table ahead of the FOMC minutes this afternoon.
Timing of the markets rate hike expectations may become a bit clear after the release, up until now, dealers and investors have been at odds with the Fed’s expectations.
Commodity and mining stocks are leading the losses in the FTSE 100 on the back of lower intraday oil prices.
Indices: Stoxx50 flat at 2,933, FTSE -0.4% at 6,143, DAX -0.2% at 9,868, CAC-40 -0.2% at 4,289, IBEX-35 flat at 8,701, FTSE MIB +0.2% at 17,532, SMI +0.5% at 7,945, S&P 500 Futures +0.1%.

