Get 40% Off
⚠ Earnings Alert! Which stocks are poised to surge?
See the stocks on our ProPicks radar. These strategies gained 19.7% year-to-date.
Unlock full list

Two Triangles And A Megaphone

Published 04/21/2015, 12:58 AM
Updated 07/09/2023, 06:31 AM

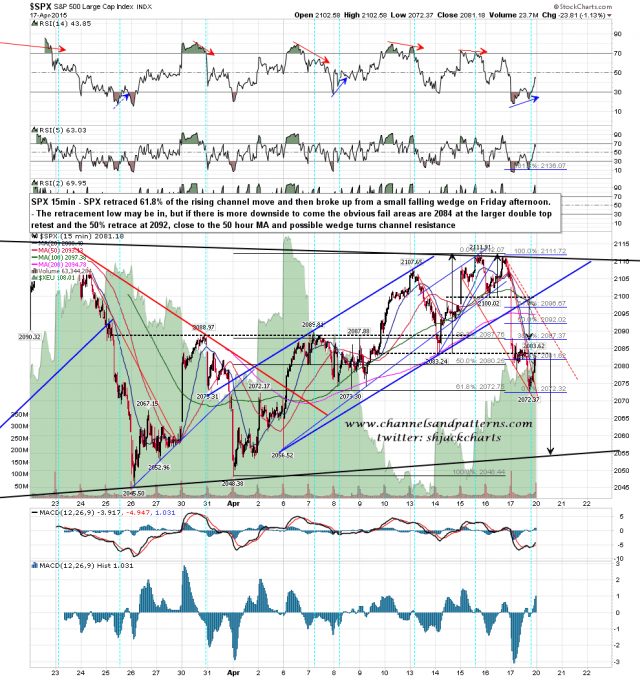
SPX fell hard on Friday, made the smaller double top target and broke down from the larger double top. Shortly after the LOD SPX broke up from a falling wedge that I called on twitter, and closed the day at a retest of broken larger double bottom support. The retracement low may be in, and if we are to see a fail without another test of triangle resistance in the 2011 area then I'll be looking for resistance at the 50% and 61.8% retracements on the falling wedge, in the 2092 and 2096.5 areas respectively. The 50 hour MA closed Friday at 2096 and is key resistance today. SPX 15min chart:
S&P 500 Large Cap Index

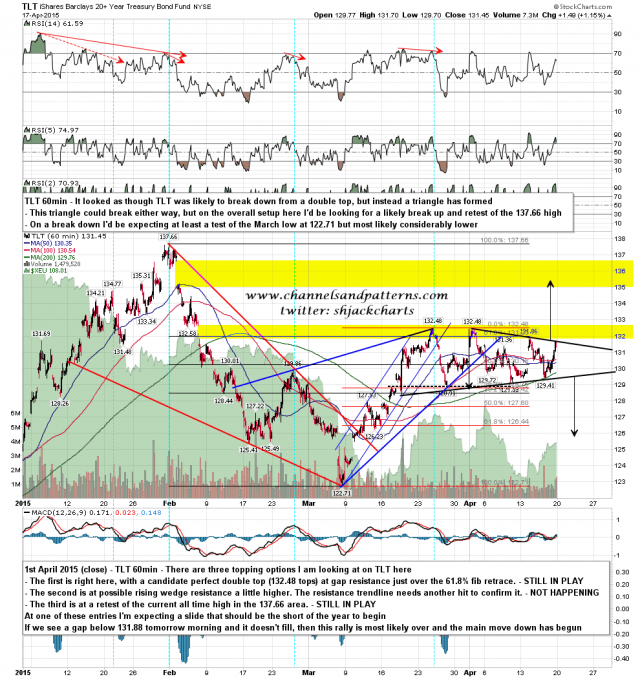
Instead of failing at the obvious double-top setup TLT has formed a triangle and tested triangle resistance late on Friday afternoon. In context, as with the SPX triangle, this is very arguably a bull flag and has at minimum a bullish lean. A break up should deliver a retest of the all time high at 137.66, a break down should take out the March low at 122.71. As ever with triangles there may be multiple false breaks before the triangle makes the genuine break higher or lower. TLT 60min chart:
TLT 1 Hour Chart

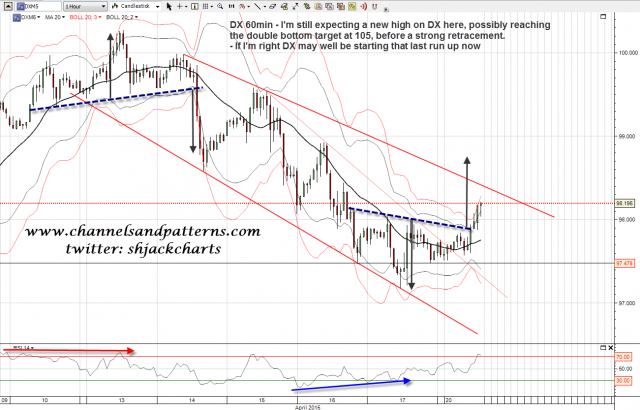
USD is forming a falling megaphone from the last high. An IHS has formed and broken up and if falling megaphone resistance breaks then I'll be looking for a last run up that may well make the double bottom target at 105, before a big retracement starts that should take DX back into the 90 area. DX 60min chart:
US Dollar Index 60 Minute Chart

ES opened strong and is already testing obvious resistance at the 50 hour MA and the 61.8% fib retracement of the falling wedge. If we see a break over triangle resistance at 2011 then I'll be looking for a test of the all time high at 2119.59.

Original post

Latest comments

Risk Disclosure: Trading in financial instruments and/or cryptocurrencies involves high risks including the risk of losing some, or all, of your investment amount, and may not be suitable for all investors. Prices of cryptocurrencies are extremely volatile and may be affected by external factors such as financial, regulatory or political events. Trading on margin increases the financial risks.
Before deciding to trade in financial instrument or cryptocurrencies you should be fully informed of the risks and costs associated with trading the financial markets, carefully consider your investment objectives, level of experience, and risk appetite, and seek professional advice where needed.
Fusion Media would like to remind you that the data contained in this website is not necessarily real-time nor accurate. The data and prices on the website are not necessarily provided by any market or exchange, but may be provided by market makers, and so prices may not be accurate and may differ from the actual price at any given market, meaning prices are indicative and not appropriate for trading purposes. Fusion Media and any provider of the data contained in this website will not accept liability for any loss or damage as a result of your trading, or your reliance on the information contained within this website.
It is prohibited to use, store, reproduce, display, modify, transmit or distribute the data contained in this website without the explicit prior written permission of Fusion Media and/or the data provider. All intellectual property rights are reserved by the providers and/or the exchange providing the data contained in this website.
Fusion Media may be compensated by the advertisers that appear on the website, based on your interaction with the advertisements or advertisers.
© 2007-2024 - Fusion Media Limited. All Rights Reserved.