Forex News and Events:
Turkey’s post-election rally remains short-lived, despite Erdogan’s tremendous victory (roughly 52%). In reality, the participation rate remained very low (75%) as a quarter of voters apparently found no candidates to their taste (among three proposed). This said, the presidential elections (with such victorious outcome) failed to restore the idea of political stability in Turkey. The leading rating agency Fitch stated that Erdogan’s victory did “little to reduce Turkey’s political risk” adding that the political risks should weigh on country’s sovereign rate. The “perceived authoritarian tendencies” of the freshly elected President Erdogan can only expand alongside with his political power, according to the agency. Fitch warning keeps the foreign investors alerted. Turkey government yields hold ground at pre-election highs; the 2-10 year spread flattens since the short-end of the curve surge significantly from end of July. The political tensions in Turkey are far from resolution as the new President Erdogan intends to change the Constitution to provide more power to the President role, and a clear majority is against such modification. The biggest fear is the deepening fragmentation in the heart of the Turkish society.
Besides the political dimension, heavy pressures exercised by Mr. Erdogan for lower rates are another major concern for investors. Despite the inflationary pressures, Turkey Central Bank cut the policy rates by 175 basis points through the latest three meetings. Thanks to international capital flows in favor of carry strategies, the CBT could act in line with ruling AKP’s will to boost economy through lower rates; however everybody knew that the situation wouldn’t last long. With rising Fed hawks and intensifying talks on the timing of the Fed normalization, the appetite for USD has only one long-term direction. Turkey is among the most UST-sensitive currencies, due to its deep current account deficit and high energy dependency. The Fed normalization period will most likely be harmful for TRY.
The gloomy outlook for Turkish lira suggests undesired impact on Turkey’s inflation. July figures showed that the core consumer prices unexpectedly deteriorated to 9.75%, mostly due to rising food prices. According to President Erdogan, the deteriorating inflation is due to high interest rates (in line with alternative neo-Fisherite theories). Naturally, investors seeking profitable real returns do not buy this idea; Turkish returns should not only cover the high inflation, yet also the high risk premium due to the geopolitical situation of the country (particularly with Isis expanding territories at the East of Turkish borders).
The USD/TRY currently trades above its 200-dma (2.1342) and is expected to shift higher in line with its EM peers. Given the macroeconomic and geopolitical situation of Turkey, we believe that a positive divergence seems challenging at this point. EM countries with similar macro fundamentals seem better positioned for the Fed exit, led by Brazil preparing the Fed normalization for over a year now.
In the option markets, buyers dominate above 2.1500 for the month ahead. The steepening in the front-end of Turkey sovereign curve should limit the flexibility for more interest rate cuts at the coming meetings. This said, we do not rule out further CBT easing, mostly due to external pressures. We keep our cautious stand versus TRY and TRY holdings.

Today's Key Issues (time in GMT):
2014-08-12T11:30:00 USD Jul NFIB Small Business Optimism, exp 96, last 952014-08-12T14:00:00 USD Jun JOLTS Job Openings, exp 4600, last 4635
2014-08-12T18:00:00 USD Jul Monthly Budget Statement, exp -$96.0B
The Risk Today:
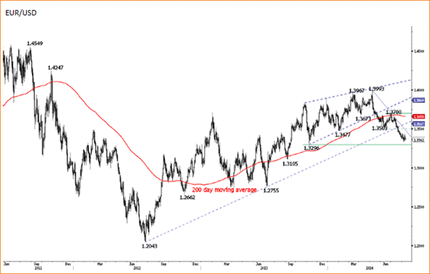
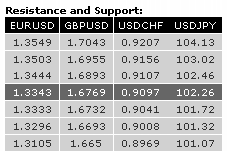
EURUSD continues to hold at the lows. The proximity of the key support at 1.3296, a short-term rebound is likely. Resistances can be found at 1.3444 and 1.3503 (05/06/2014 low). An hourly support stands at 1.3333 (06/08/2014 low). In the longer term, EUR/USD is in a succession of lower highs and lower lows since May 2014. The downside risk is given by 1.3210 (second leg lower after the rebound from 1.3503 to 1.3700). A strong support stands at 1.3296 (07/11/2013 low). A key resistance lies at 1.3549 (21/07/2014 high).
GBPUSD remains weak, as can be seen by the continued development of new lows (1.6775 intraday). Bullish rallies quickly lose momentum. A break of the resistance at 1.6893 (01/08/2014 high) is needed to suggest exhaustion in short-term selling pressures. Another resistance can be found at 1.6955 (30/07/2014 high). In the longer term, the break of the major resistance at 1.7043 (05/08/2009 high) calls for further strength. Resistances can be found at 1.7332 (see the 50% retracement of the 2008 decline) and 1.7447 (11/09/2008 low). A key support stands at 1.6693 (29/05/2014 low, see also the 200 day moving average).
USDJPY has strengthened but bearish pressures remain. Last week, the hourly support at 101.72 was broken. Another minor support lies at 101.32, while a key support stands at 101.07. Hourly support can be found at 102.00 (07/08/2014 low) and resistance is located 102.46 (07/08/2014 high). A long-term bullish bias is favoured as long as the key support 99.57 (19/11/2013 low) holds. However, a break to the upside out of the current consolidation phase between 100.76 (04/02/2014 low) and 103.02 is needed to resume the underlying bullish trend. Another resistance can be found at 104.13 (04/04/2014 high), while a major resistance stands at 110.66 (15/08/2008 high).
USDCHF displays many significant daily upper shadows near the resistance at 0.9107, suggesting strong selling pressures close to these levels. Monitor the support at 0.9041 (01/08/2014 low), as a break would invalidate the short-term bullish technical structure. Other supports can be found at 0.9008 (24/07/2014 low) and 0.8969 (17/07/2014 low). From a longer term perspective, the recent technical improvements call for the end of the large corrective phase that started in July 2012. The long-term upside potential implied by the double-bottom formation is 0.9207. Furthermore, the break of the resistance at 0.9037 calls for a second leg higher (echoing the one started on 8 May) with an upside potential at 0.9191. As a result, a test of the strong resistance at 0.9156 (21/01/2014 high) is expected.

