Here's the regular 5 macro technical charts (commodities, currencies, bonds and sectors as well as the major indexes and benchmarks). Even if you're not technically minded, it's a useful way to track trends.
1. EUR/USD: Broken Rectangle
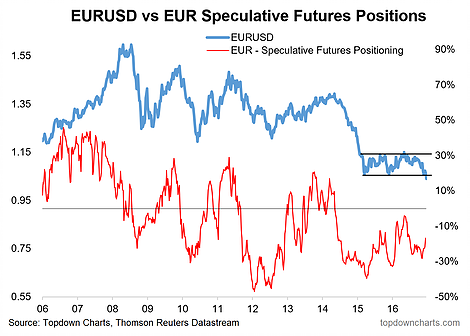
-EUR/USD has made a downside break of the large rectangle pattern seen on the weekly chart. At the same time, speculative futures positioning has come back somewhat, so you wouldn't say it's particularly stretched at this point, and thus could go further.
As noted previously, rectangle patterns, like symmetrical triangles, can act as continuation or reversal patterns -- the key is the breakout; the cautionary for EUR/USD is there have been a few false breakouts so far; the other point is that a move back toward the top of the range or consolidation zone would be almost a 1000pip move (!)
- Overall technical view: Bearish, but beware of false breakouts
2. S&P 500: Santa Claus Status
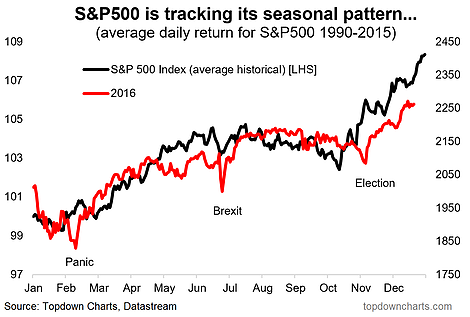
Seasonality has worked pretty well so far this year and based on the charts, there could still be some upside from seasonality yet to come with the famous or infamous "Santa Claus rally" potentially in play.
The key caveat is that seasonality can break at any moment and the chart shows some notable deviations from the historical seasonal pattern.
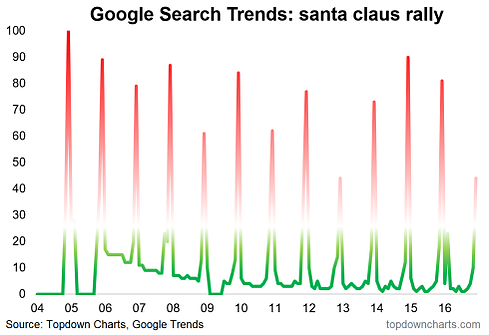
As a bonus fun chart for the season, Google (NASDAQ:GOOGL) Search Trends data is showing an uptick in interest for the santa claus rally (albeit December is partial data).
- Overall technical view: Bullish bias on seasonality
3. Emerging-Market Equities: Vulnerable
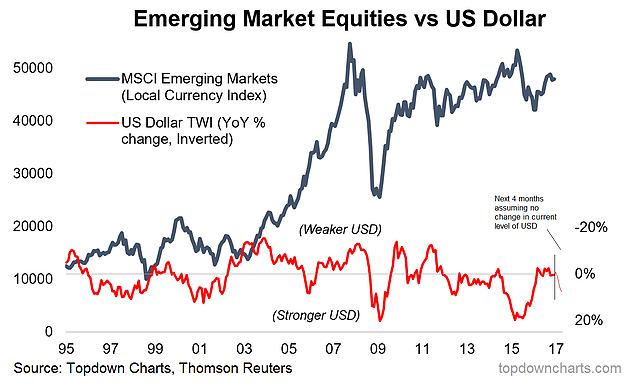
The chart below shows emerging-market equities' vulnerability to the swings in the US dollar (the indicator is the US dollar trade-weighted index, year-over-year change, inverted). Chart is from the latest Weekly Macro Themes report.
Typically, emerging-market stocks will face headwinds when the indicator turns down (US dollar strengthens), so it's worth noting that even if the US dollar index holds steady at the same level for the next 4 months, the indicator will make a notable turn down (to as much as a YoY gain of 8% in April).
At the same time, emerging-market equity ETFs are trading right around their 200-day moving average and are thus vulnerable to a breakdown on further US dollar strength.
- Overall technical view: Bearish bias, on watch for possible breakdown
4. Bonds: Stretched Sentiment
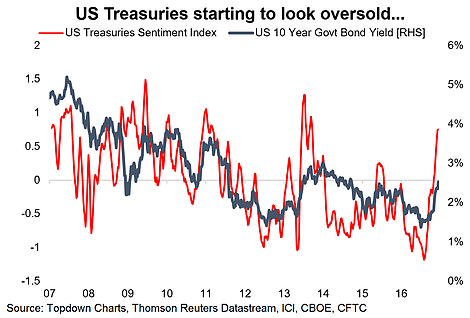
Our bond sentiment indicator (uses mutual fund flows, speculative futures positioning, bond market implied volatility and bond breadth) is looking increasingly stretched -- similar to the 2013 taper tantrum. Note, this chart also appeared in the latest edition of the Weekly Macro Themes report.
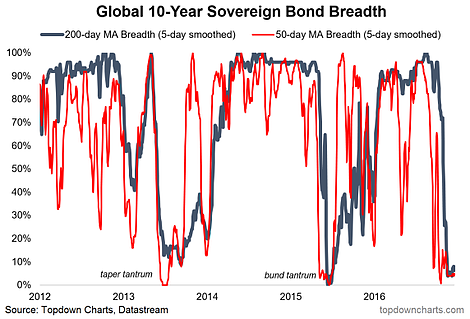
At the same time, sovereign bond breadth looks to be in the process of bottoming out.
Need to see a turn back in sentiment and a turn up in breadth for confirmation; it's worth noting that previous bottoms have taken some time to form, despite sharp corrections.
- Overall technical view: Bearish bias, but temper bearishness on oversold indicators
5. Commodities: Breadth Divergence
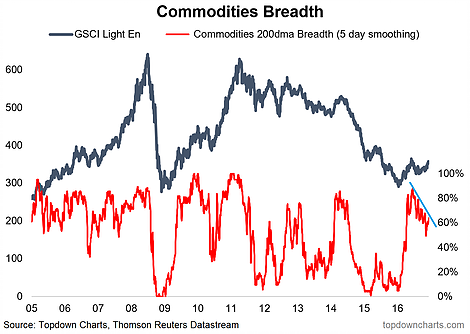
Commodities as an asset class are seeing breadth divergence for the S&P GSCI (note: this chart has been prepared using the individual commodities that make up the GSCI).
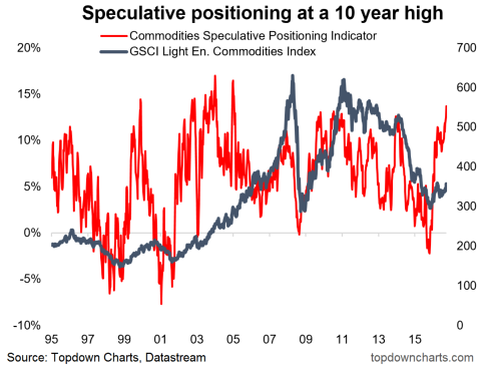
On a similar (arguably bearish) note, average speculative positioning across commodities is stretched to the upside at a 10-year high.
Appears to be an ascending triangle forming, which will serve as an important trigger point (downside break vs. upside break) in setting direction, as the breadth divergence could resolve to the upside and the stretched positioning is common around a market bottom.
- Overall technical view: Bearish bias, but on watch for a breakout (either way).
