
The TRY/JPY pair is one that I like a lot. This is one that I will go to in order to take advantage of any potential “carry trades”, as the interest rate differential between the two currencies is significant. The pair has a reasonable spread, and can also be thought of as a play on “risk appetite” as well, as Turkey is certainly one of the areas that a lot of “hot money” likes to go to.
The pair has been sold off massively, as the investment community worries about the Erdogan Administration, and the corruption scandals that have recently been in the news. The move has been violent, and without a doubt is in the possible “oversold” category at the moment. Can this pair go lower? Of course it can, but I believe that as we reach the bottom of the larger consolidation area, we are at a point on the chart where taking the risk of a long makes sense for a couple of reasons.
The first one is fundamental. With the way the Turkish lira has been depreciating lately, the central bank in Ankara may be forced to raise interest rates in order to attract more inflows. This of course will more than likely attract Forex positivity, and that of course would be even more interesting against a currency like the Yen, which of course is everyone’s favorite punching bag at the moment. Remember, things don’t have to be great for a trade to move in the favor of one currency over another – they just have to be relatively better. We are comparing two currencies here, that’s it.
The technical work suggests that the 47.75 level is the bottom of a major consolidation area, and I am always interested in an oversold market at massive support. If the pair is going to bounce – it makes sense to do it here. On top of that, the daily candle is starting to form a hammer as I write this, and the Stochastic Oscillator is in oversold territory, with a potential crossover happening as well. All things being equal – this pair is worth the risk to me.
As far as how high it could go, ultimately it could continue the consolidation and go to 50.75 in my opinion. Of course, that is going to take serious time and positive news, but I would also think that a move to 49 should be reasonable, so it really comes down to how much volatility you can take.
On the other hand, if we break the bottom of the hammer – look out below. Remember, a failed trade can sometimes be a signal in and of itself. One of the best things I have ever heard is that “we are paying for information every time we take a trade.” Essentially, the idea is you are risking a percent or two of your account to see if this is where the buyers are coming into the market. If they aren’t, and the selling pressure continues, a percent isn’t much considering how profitable that information can be. Simply do what the market tells you to do. Nothing more, nothing less. 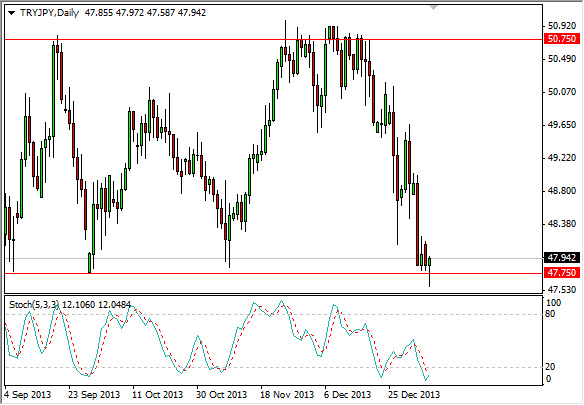 TRY/JPY Daily Chart" title="TRY/JPY Daily Chart" width="452" height="405">
- English (UK)
- English (India)
- English (Canada)
- English (Australia)
- English (South Africa)
- English (Philippines)
- English (Nigeria)
- Deutsch
- Español (España)
- Español (México)
- Français
- Italiano
- Nederlands
- Português (Portugal)
- Polski
- Português (Brasil)
- Русский
- Türkçe
- العربية
- Ελληνικά
- Svenska
- Suomi
- עברית
- 日本語
- 한국어
- 简体中文
- 繁體中文
- Bahasa Indonesia
- Bahasa Melayu
- ไทย
- Tiếng Việt
- हिंदी
TRY/JPY Pair Has Been Sold Off Massively
Published 01/06/2014, 09:45 AM
Updated 07/09/2023, 06:31 AM
TRY/JPY Pair Has Been Sold Off Massively
3rd party Ad. Not an offer or recommendation by Investing.com. See disclosure here or
remove ads
.
Latest comments
Install Our App
Risk Disclosure: Trading in financial instruments and/or cryptocurrencies involves high risks including the risk of losing some, or all, of your investment amount, and may not be suitable for all investors. Prices of cryptocurrencies are extremely volatile and may be affected by external factors such as financial, regulatory or political events. Trading on margin increases the financial risks.
Before deciding to trade in financial instrument or cryptocurrencies you should be fully informed of the risks and costs associated with trading the financial markets, carefully consider your investment objectives, level of experience, and risk appetite, and seek professional advice where needed.
Fusion Media would like to remind you that the data contained in this website is not necessarily real-time nor accurate. The data and prices on the website are not necessarily provided by any market or exchange, but may be provided by market makers, and so prices may not be accurate and may differ from the actual price at any given market, meaning prices are indicative and not appropriate for trading purposes. Fusion Media and any provider of the data contained in this website will not accept liability for any loss or damage as a result of your trading, or your reliance on the information contained within this website.
It is prohibited to use, store, reproduce, display, modify, transmit or distribute the data contained in this website without the explicit prior written permission of Fusion Media and/or the data provider. All intellectual property rights are reserved by the providers and/or the exchange providing the data contained in this website.
Fusion Media may be compensated by the advertisers that appear on the website, based on your interaction with the advertisements or advertisers.
© 2007-2024 - Fusion Media Limited. All Rights Reserved.