Trend Model February 2015 Report Card: -4.0% Drawdown
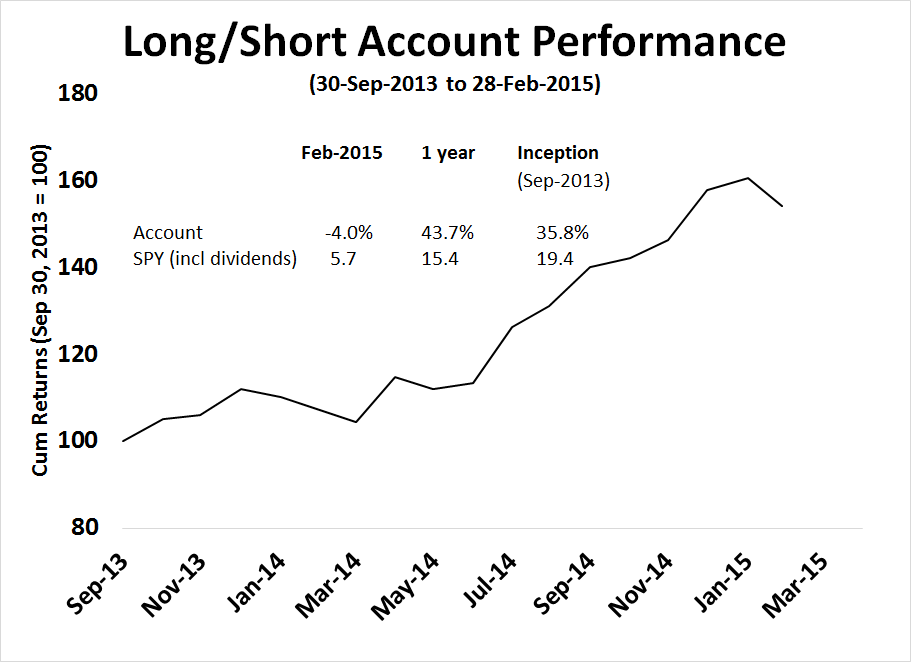
The winning streak, which lasted eight months, finally came to an end. The Trend Model account fell -4.0% in February; the one-year return was 43.7%; and the return from inception of September 30, 2013 was 35.8%. The batting average of positive to negative months remains highly respectable at 71%.

I reiterate my disclaimer that I have nothing to sell anyone right now. I am not currently in a position to manage anyone`s money based on the investment strategy that I am describing.
Trend Model description
For readers who are unfamiliar with my Trend Model, it is a market timing, or asset allocation, model which uses trend following techniques as applied to commodity and global stock market prices to generates a composite Risk-On/Risk-Off signal (risk-on, risk-off or neutral). I have begun updating readers on the Trend Model signals on a weekly basis (for the last weekly comment, see The upside breakouts are holding) and via Twitter @humblestudent as new developments occur.
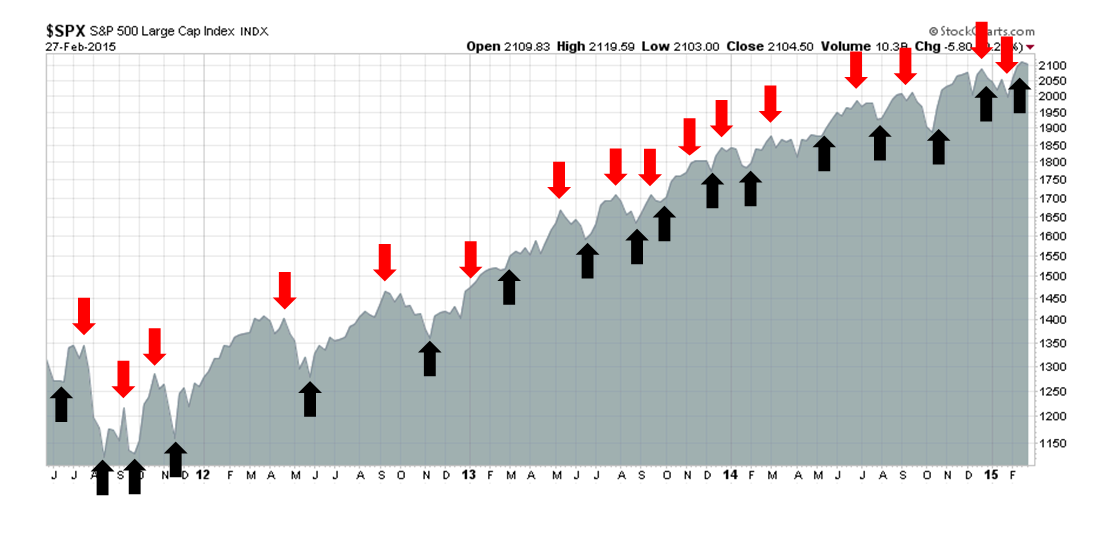
The chart below shows the actual (not back-tested) changes in the direction of the signal, which are indicated by the arrows, overlaid on top of a chart of the S&P 500. You can think of the blue up arrows, which occurred when the trend signal changed from negative to positive, as buy signals and the red down arrows, which occurred when the trend signal changed from positive to negative, as sell signals.
Trend Model Signal History

A proof of concept
While the results from the above chart representing paper trading is always interesting, there is no substitute for actual performance. As a proof of concept, I started to manage a small account that traded long, inverse and leveraged ETFs on the major US market averages and, on occasion, sector and industry ETFs. Trading decisions were based on Trend Model signals combined with some short-term sentiment indicators. The inception date of the account was September 30, 2013 and the chart below represents an interim report card of that account. (For more details on how the Trend Model or how the account is managed, see my post Trend Model FAQ).
When evaluating the performance of this trading account, keep in mind that this is intended to be an absolute return vehicle. While I do show the SPDR S&P 500 (ARCA:SPY) total return, which includes re-invested dividends, for illustrative purposes, the S&P 500 is not an appropriate benchmark for measuring the performance of this modeling technique.
A difficult February
The account was down -4.0% in February, 43.7% for one year and 35.8% from inception (September 2013). However, I would also like to point out that turnover averaged about 200% per month, so this strategy is not for everyone.
Despite the positive returns shown by the account, the market environment was especially challenging for this kind of trading system. The Trend Model signals are primarily based on the application of trend following principles to global stock and commodity markets. Trend following systems simply do not perform well in either sideways markets that are subject to whipsaw, or markets that experience sharp reversals.
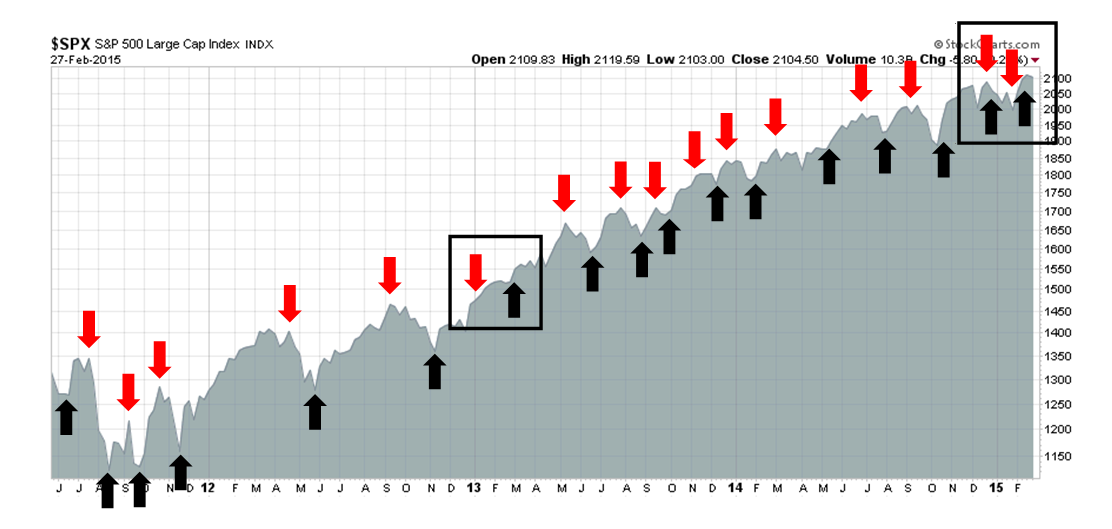
For readers who have been following my trading signals, the first couple of months was characterized by a whipsaw signals, which are marked by the rectangles in the signal history chart below. It was therefore no surprise that the account saw a loss in the month of February. Indeed, I was somewhat surprised to see a positive performance of 1.9% in January.
Despite the challenging environment, this strategy continue to be promising:
- Returns are strong and the Trend Model is performing roughly as expected.
- Return consistency is still positive with a 71% batting average.
- Returns are highly diversifying compared to major asset classes. They are uncorrelated with equities (correlation of -0.31 with SPY) and bonds (-0.34 with ARCA:AGG).
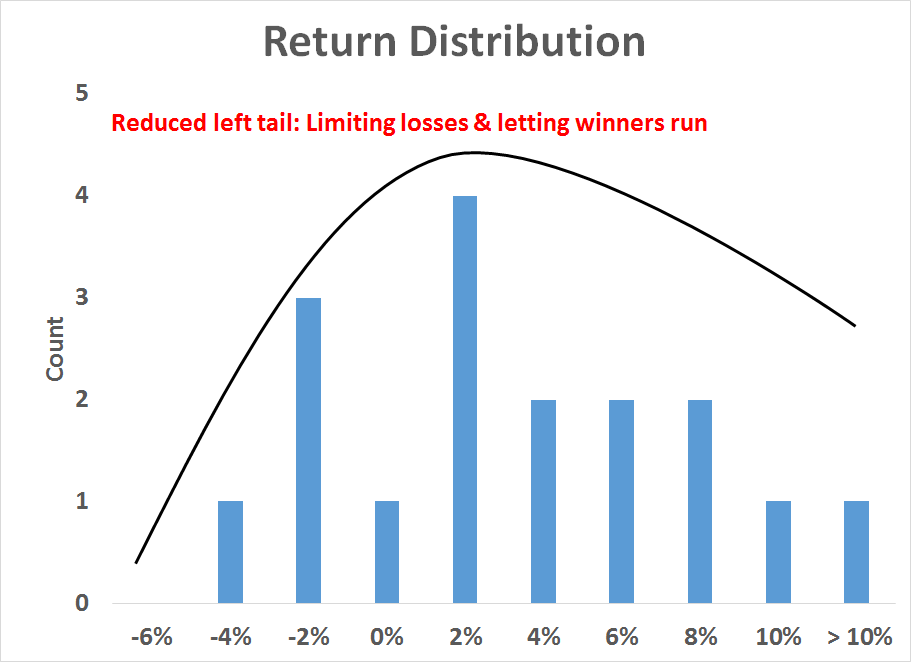
In addition, a study of monthly returns show that this strategy tends to let winners run and limit losses. While the sample size is still relatively small, the chart below shows that the distribution of monthly returns are skewed to the right with returns all the way up to 10% or more, while the negative returns that appear on the left are limited at the 2-4% level. 
2015 could be an acid test year
I continue to believe that the market environment is likely to be challenging for both stocks and the Trend Model trading strategy in 2015. In a recent market review, I postulated a positive year for US stock prices but with a much higher (see 2015: Bullish skies with scattered periods of volatility). Trend following models do not perform well in choppy markets.
The stock market does see increased volatility, then the choppiness will indeed be an acid test for this trend following strategy. Positive returns during these volatile periods will lean more on the short-term sentiment models that I use to better assist the main trend following model to calibrate both entry and exits as well as the magnitude of position commitment.
