The whole idea of Trend Line Analysis is to capture the Price Action over the naked charts and find the most optimum zones for buy or sell. The trend line analysis done on the candle stick charts simply light the path for the price to travel.
EUR/JPY
We are looking for a move lower around to 135.08-1X to enter longs for an initial move to 136.6X with potential run higher to around 138.00 handle.
With pressure lifted off euro on the Grexit issue; the pair is looking to make some headwinds at least on the crosses. euro crosses are enjoying a rally and with EUR/JPY recently managed to close higher to the bear channel it’s been trading within; we look for the continuation on the current move.
With this in mind; we ideally would like to see a test lower to 135.08-1X to get a re-test to the breakout point and enter longs for the intended target.
Longs from 135.20-30 can give a risk to reward ratio considering our initial run ideally should show a print of 136.6X with prime target been the test to the T3 trend line.
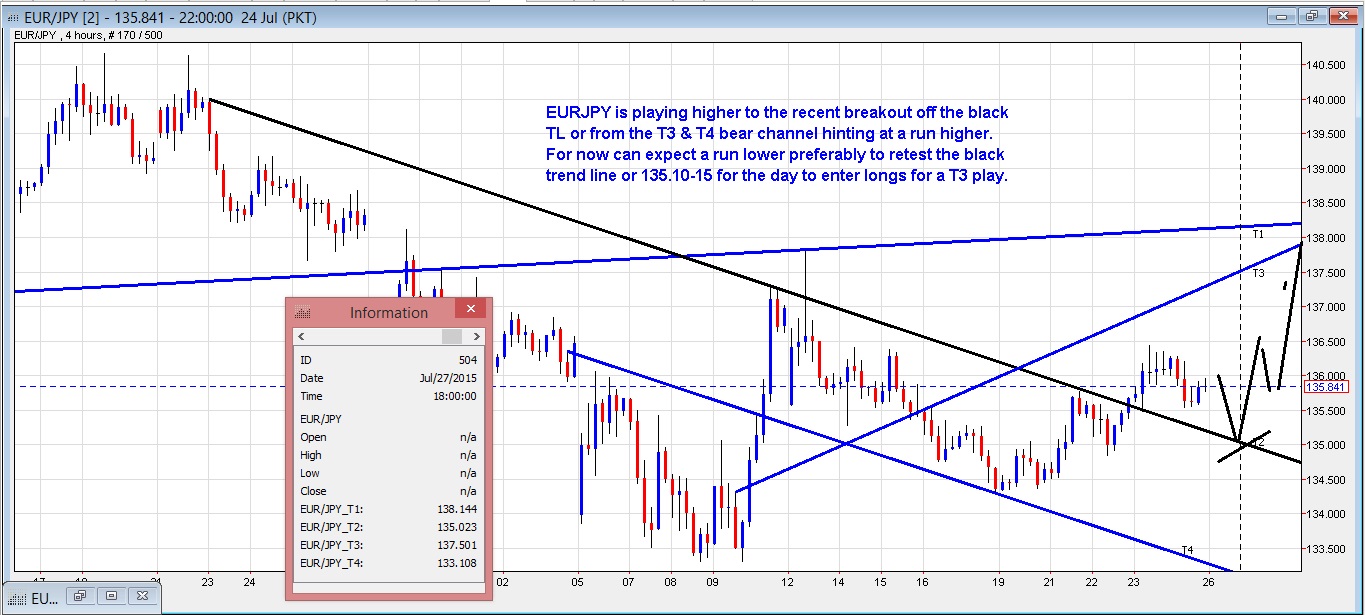 EUR/JPY 4 hrs – Looking for lower 135.1X to enter longs for a move close to 138
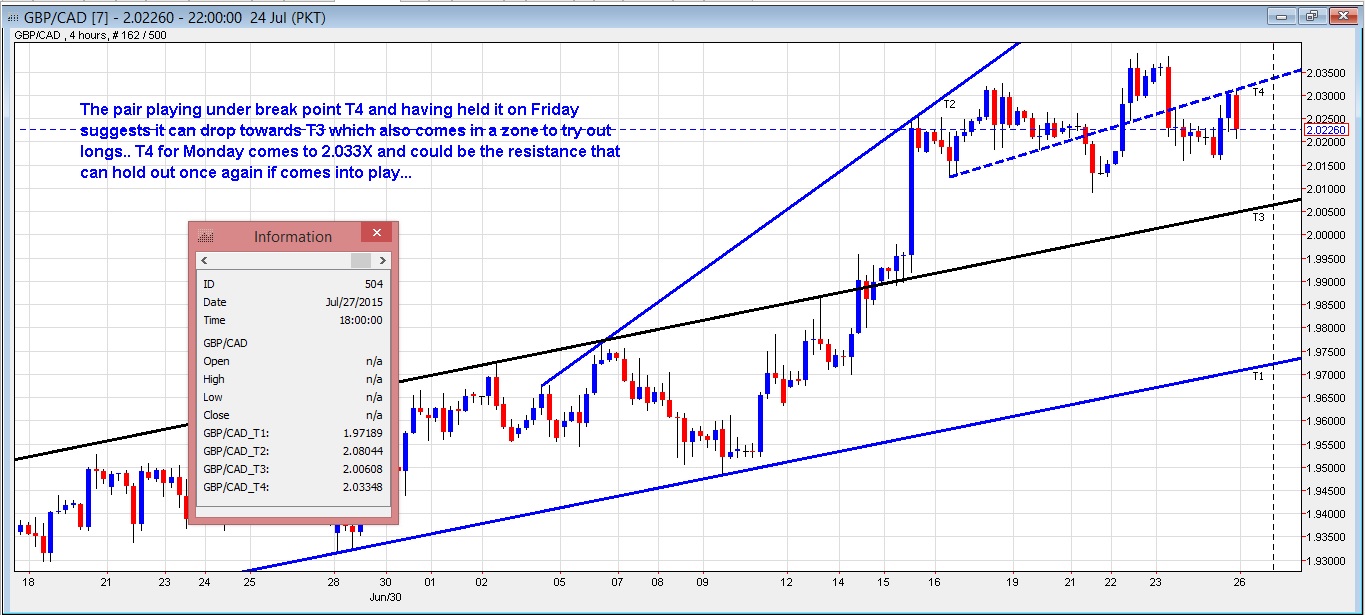
We are interested to carry forward from Friday’s theme on setting shorts in. We have 2 different zones on the pair to try shorts. Our preferred chart from Friday was the 4 hrs and that level now comes to 2.033X and 2 hrs which shows the extended on the resistance comes toward 2.037X.
The better entry obviously would be 2.037X to go short; but if aggressive can head from 2.033X if this level gets a test and wait to see if it holds.
We had a splendid run on the pair on Friday. We still feel the pair has dip to come towards the 4 hr base or 2.006X and we can attempt longs if price comes to it for the day. The longs can still do wonders by printing in new yearly highs considering BOC is dovish and BOE is hawkish. Hence overall view on the pair is bullish.
To reiterate; initially it is looking to be a good idea to set shorts from the intended zone/s only to reverse for longs on dips for new yearly highs.
 p
p
GBP/CAD 4 hr – This scenario prefers short indicating there is more on the drop before the surge back higher
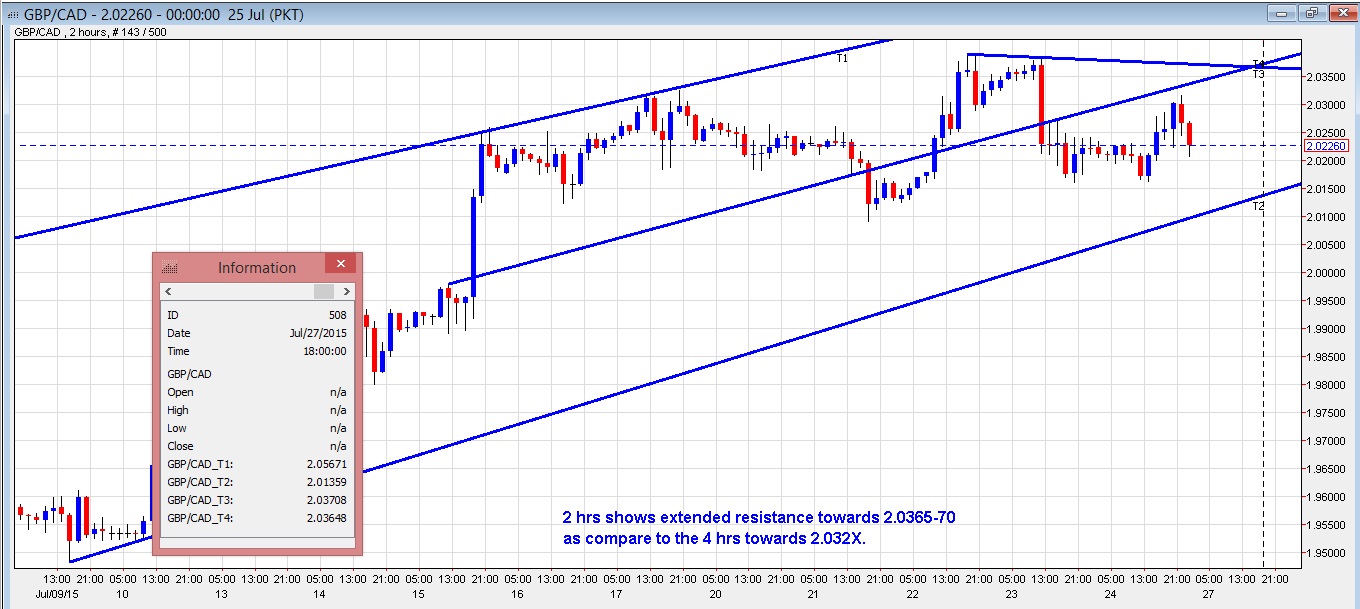 GBP/CAD 2 hr – Extended resistance up to 2.0365-7X
We are looking to set shorts ideally into 192.7X for a possible move lower to 190.2X and subsequently to long off the target zone for a possible meatier target into 196 handle.
We are looking at what looks to be a possible Inverse Head & Shoulder and originally was expecting Right Shoulder to end to 192.2X. We had an earlier decent bounce off it; but than later it fell under and this is hinting that Right Shoulder can come in lower as shown in the 4 hrs chart layout. Overall scenario on the pair is bullish but an initial dip lower seems to be on the card.
4 hrs chart layout shows resis to 192.5X and 2 hrs shows extended to 192.7X. Naturally getting shorts off 192.7X be better as compare to 192.5X and as such we keep options open to see if price once tested 192.5X shows any holding pattern to go short else try off 192.7X.
The ideal target comes to 190.2X and can look to long off there for the bigger moves likely to see trying a 196 handle out.
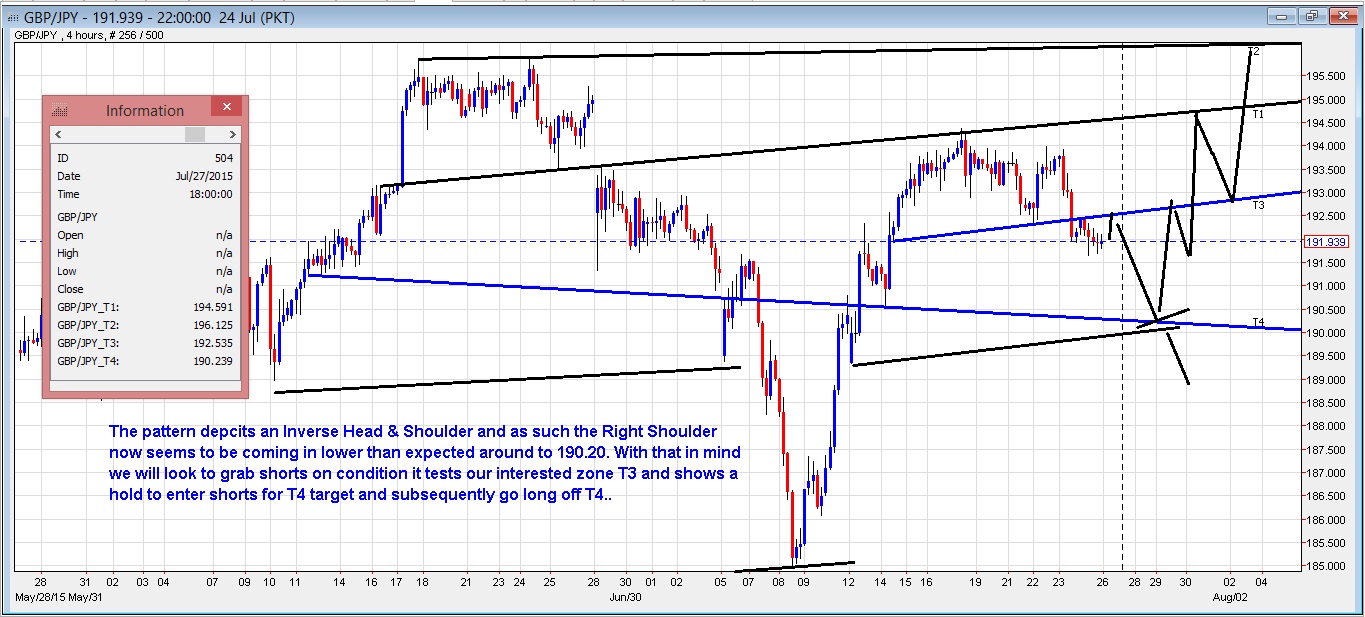 GBP/JPY 4 hrs Inverse Head & shoulder Pattern Valid
 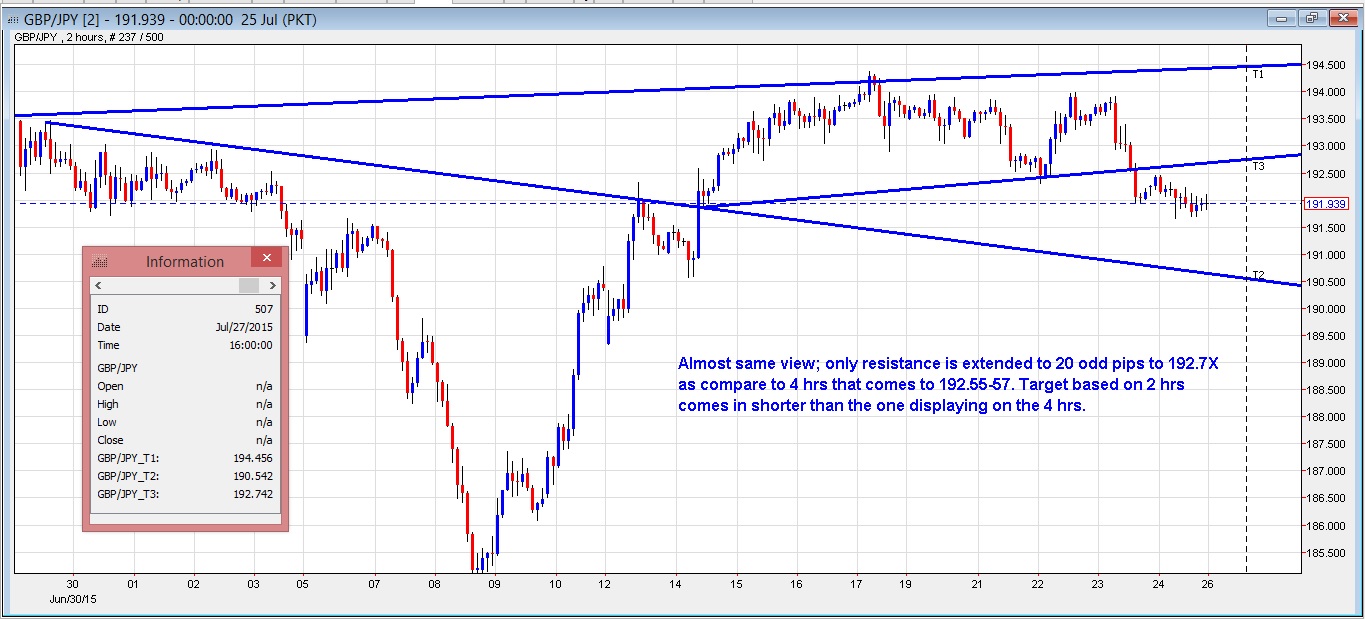 GBP/JPY 2 hrs – Extended resistance and shortened Support
Our layout done on Thursday is still valid.
Please review Thursday’s post on 23/07/2015
