We are looking for minor new high for the year to set shorts up on the pair in anticipation of a relief rally to be seen.
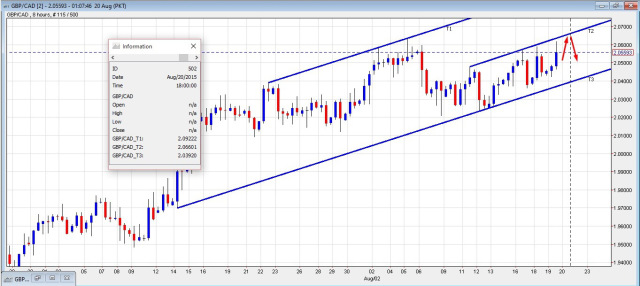
We are looking at T2 on the 8 hrs chart that comes in as a possible channel top to see a test and a hold to enter shorts for an initial 100-120 pips move with potential run lower towards 2.0400 handle.
CAD has been the weakest link so far mainly due to the falling oil prices, as Iran is gearing to supply oil after the sanctions have been lifted. With already weak oil prices, Iran will add more supply to already weaker demand, pushing oil lower, which weakened CAD against all majors. It was unable to stage rally against the US dollar as most of its counter part did when Fed failed to initiate that an imminent rate hike will be coming in September. US dollar was sold furiously, with USD majors breaking day ranges to the higher side; USD/CAD, on the other hand, fell victim to the falling oil prices.
GBP, on the other hand, enjoyed some healthy data along with comments from MPC member that UK is in solid recovery increasing the chance of a possible rate hike to be seen in near future, perhaps in early 2016.
GBP/CAD, therefore, overall is still bullish, and we are only trying to catch a swing trade, considering we get to see a minor new high and the pair topping out to our desired handle to enter shorts. The pair just may be in need for a relief drop to find fresh round of buying to prop it up higher.
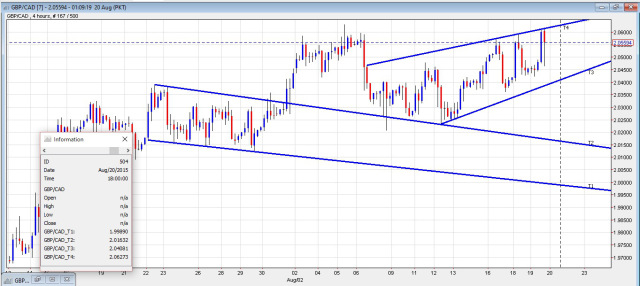
Hence, 2.0650-6X comes in as an ideal looking zone to enter shorts based on 8 hrs, and if aggressive, can use 4 hr zone roughly 30 pips lower to the 8 hrs time frame to enter shorts.

GBP/CAD 8 hr – T2 possible channel top ideal for shorts

GBP/CAD 4 hr – T4 possible rising wedge top to set shorts off if aggressive
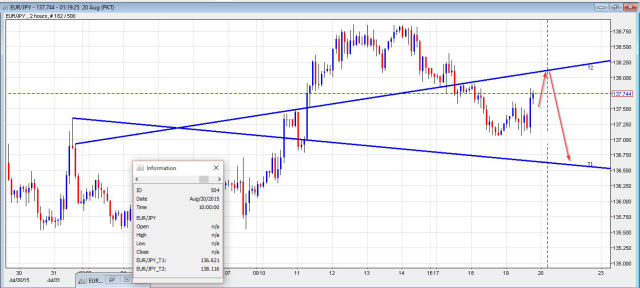
We feel there is yet some lows to be seen on the pair, and as such, would like to see a test of 138.1X unfolding and a hold to this level to consider going short on the pair for an initial move towards 137.5X, with potential run lower to mid 136.XX
JPY has seen a number of factors coming into play assisting the currency with falling stocks; namely, Chinese falling off 6% prompted investors to buy JPY and CHF as safe havens. JPY also saw slightly better economic data, with trade deficit shrinking a bit due to lower oil prices and was able to rally today against the US dollar and almost all other majors before seeing reversal on EUR/JPY.
EUR was mainly on the defensive mode ever since it posted the high of 1.1214 last week, and the weakness was seen on almost all its crosses. EUR was one of the key benefactors of dovish FOMC rallying up, with EUR/JPY getting a lift off from the 137.10 low and printing a minor new high for the day to 137.83.
We expect there could be some more up on the pair, and should it move higher to 137.8X listed resistance, it should be able to test 138.1X out and if it shows, hold to here; we have an interest to sell for a possible move down to 136.5X, while looking for an initial 50 odd pips.

EUR/JPY 2 hrs – T2 looks decent zone to enter shorts on the pair
