Implied volatility in the S&P 500 is in the tank, is this a sign of things to come?
Traders have been asking themselves all summer how low volatility can go. Thus far, the question hasn't been answered. Although it is true that we never expected volatility, and specifically the VIX, to reach the depths we've seen in recent weeks, we also know this is not a permanent market state. In the moment, complacency can feel like it lasts forever, but in reality it never does.
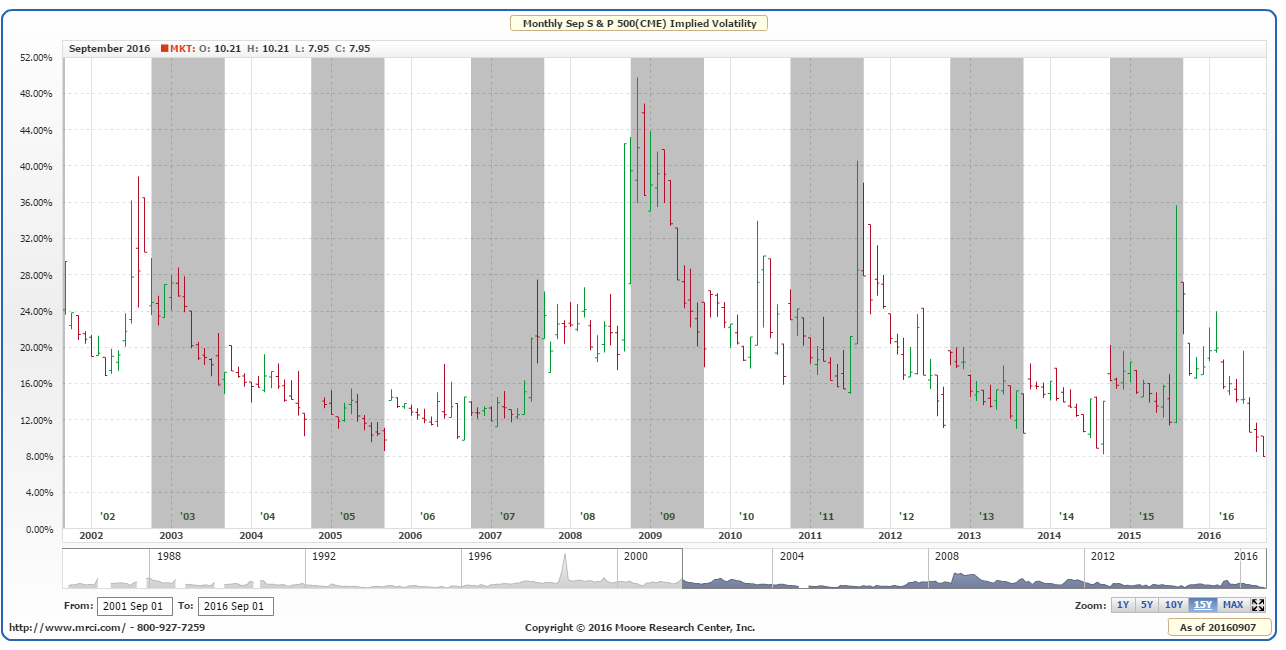
The chart above depicts the implied volatility of S&P options on futures according to MRCI (implied volatility is simply the expectations of future volatility built into option pricing). It is apparent that as we approach 8% in implied volatility, the odds are swiftly in favor of a change in sentiment (higher volatility and likely lower stock prices). According to this study, the implied volatility has never dipped below 8%, and has bottomed near 8% on two other occasions since 2002.
Now is (roughly) the cheapest time in well over a decade to buy S&P put options. It might be worth having a few lottery ticket flyers out there. For instance, the December 1850 puts can be bought for about $425 and give you 100 days in the market with risk under $500.

Treasuries finally broke out of the trading range
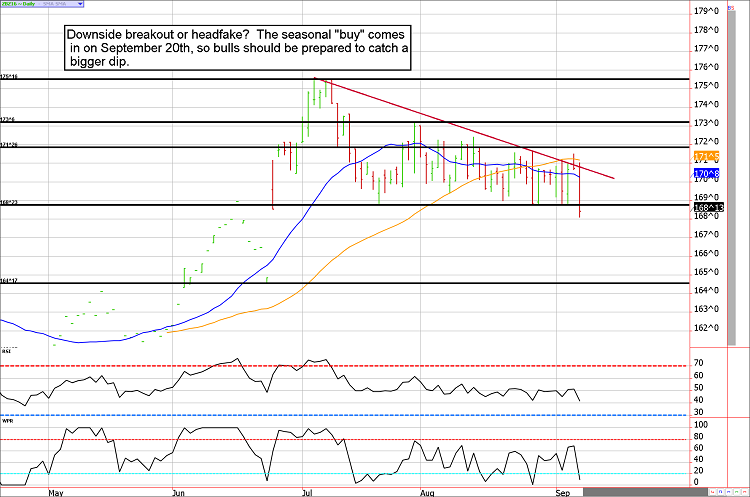
Bonds failed to hold support during today's trading session, leaving both markets in breakout territory. However, markets don't comply to simple rules. It is very possible today's move was simply sell stop running and could be reversed tomorrow.
If we get follow through selling tomorrow, the next stopping point in the 30-year bond would probably be the mid-164 area. If tomorrow is an up day, Thursday's trade was likely nothing more than a one-day wonder.
There is a seasonal "buy" signal coming in on September 20th. If the bulls are lucky, we'll see a quick plunge to the next support level which would likely be a high probability area to be a bull from.

Treasury Futures Market Analysis
**Bond Futures Market Consensus:** In a perfect world, the ZB would fall to the 164'17 area, which should be a good place for the bulls to get comfortable.
**Technical Support:** ZB : 168'02 and 164'17 ZN: 130'11 and 128'23
**Technical Resistance:** ZB: 171'26, 173'06, and 175'16 ZN: 132'02, and 133'14
The big picture is relatively clear, but the micro view of the ES is blurry at best
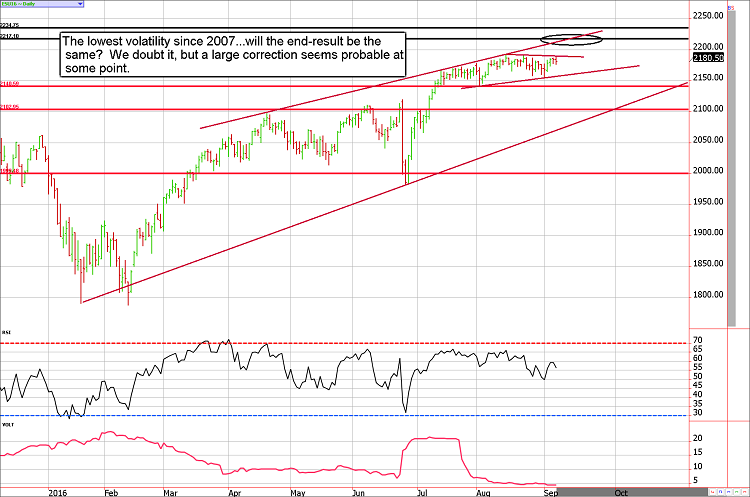
In the first section of this newsletter, we outlined the fact that we are experiencing historically low volatility levels. In fact, this type of dull trade only occurs a few times per decade or less. Although it is an infrequent occurrence, the result is frequently the same...a sharp increase in market volatility.
The problem is, it is impossible to determine the timing of the environment change. When it finally happens, it will be virtually "overnight", and the timing could be a week away or it could be months away. All we can say is there is no reason to be aggressively bullish. Bears should look for large rallies to play off, and bulls should keep trades small and hedged.

Stock Index Futures Market Ideas
**e-mini S&P Futures Market Consensus:** The market is growing dangerously overbought, but that doesn't mean we can't see 2217 or even 1235 before rolling over. We wouldn't want to be long, the ES could be an accident waiting to happen.
**Technical Support:** 2140, and 2102
**Technical Resistance:** 2199, 2217, and 2234
e-mini S&P Futures Day Trading Ideas
**These are counter-trend entry ideas, the more distant the level the more reliable but the less likely to get filled**
ES Day Trade Sell Levels: 2192, 2201, and 2217
ES Day Trade Buy Levels: 2172 (minor), 2159, and 2141
In other commodity futures and options markets....
June 23 - Go long corn futures near 392 using mini contracts (the beginning of a scale trade). Full-sized contracts can be used if available margin and risk tolerance is appropriate.
June 30 - Buy September mini (or full-sized) wheat near $4.47.
July 5 - Add to the long mini corn (or full sized) near $3.45.
July 14 - Sell the corn add-on near 370 to lock in a profit (hold the original entry).
July 14 - Add to the short ES call trade by selling a September 2235 call for about 10.000 in premium.
July 29 - Buy back September ES 2235 call to lock in gain.
July 29 - Buy mini corn future near $3.33 to average entry cost lower.
July 29 - Buy mini wheat to add to our long and adjust the average position entry to $4.25ish.
August 18 - Sell half of the mini wheat position to lock in a profit of about 20 cents on the add-on contract. We'll hold the original position in hopes of a continued upswing.
August 18 - Sell November crude oil 56 call for about 50 cents ($500).
August 25 - Buy back crude oil 56 call to lock in a quick profit (roughly $230 to 280 per contract depending on fill prices).
August 25 - Buy back the ES 2200 call to lock in moderate gain ahead of Yellen's speech.
August 29 - Sell December live cattle 99 put for about 140 (or $560).
DISCLAIMER: **There is substantial risk of loss in trading futures and options.** These recommendations are a solicitation for entering into derivatives transactions. All known news and events have already been factored into the price of the underlying derivatives discussed. From time to time persons affiliated with Zaner, or its associated companies, may have positions in recommended and other derivatives. Past performance is not indicative of future results. The information and data in this report were obtained from sources considered reliable. Their accuracy or completeness is not guaranteed. Any decision to purchase or sell as a result of the opinions expressed in this report will be the full responsibility of the person authorizing such transaction. Seasonal tendencies are a composite of some of the more consistent commodity futures seasonals that have occurred over the past 15 or more years. There are usually underlying, fundamental circumstances that occur annually that tend to cause the futures markets to react in a similar directional manner during a certain calendar year. While seasonal trends may potentially impact supply and demand in certain commodities, seasonal aspects of supply and demand have been factored into futures & options market pricing. Even if a seasonal tendency occurs in the future, it may not result in a profitable transaction as fees and the timing of the entry and liquidation may impact on the results. No representation is being made that any account has in the past, or will in the future, achieve profits using these recommendations. No representation is being made that price patterns will recur in the future.
