In my last article I detailed “one way” to trade stocks using bonds. In this article let’s look at “one other way” to trade stocks using bonds.
See also Jay Kaeppel Named Portfolio Manager for New Investment Program
The Premise
Momentum has long been used by traders to identify “something” that is performing better (or worse as the case may be) than something else. So we will compare the momentum for SPY to the momentum for HYG to identify which is outperforming at any given point in time. To do this we will simply compare the 252 trading day % change in SPY to the 252 trading day % change in HYG.
The Particulars
*For our “stock” component we will use ticker SPY (the ETF that tracks the S&P 500 Index)
*For our junk bond component we will use ticker HYG (the iShares high yield corporate bond ETF, which started trading in April of 2007)
*Because we are shooting for maximum returns, for trading purposes we will use ticker ULPIX (which is the leveraged ProFunds mutual fund that seeks to track the daily change for the S&P 500 Index times 2).
*When we are out of ULPIX we will simply hold cash. For our purposes, an annual rate of 1% of interest is used.
We will start our test on 4/11/2008 (rather than 12/31/2007 for the test in Part 1) because HYG started trading on 4/11/2007 and we need 252 trading days to make our first 252-day rate-of-change calculation.
The Calculations
A = SPY today / SPY 252 trading days ago
B = HYG today / HYG 252 trading days ago
C = (A – B)
If C > 0 then at the next close Buy (or continue to hold if already long) ticker ULPIX
If C < 0 then at the next close Sell ticker ULPIX and move to cash (or remain in cash if C was previously less than 0.
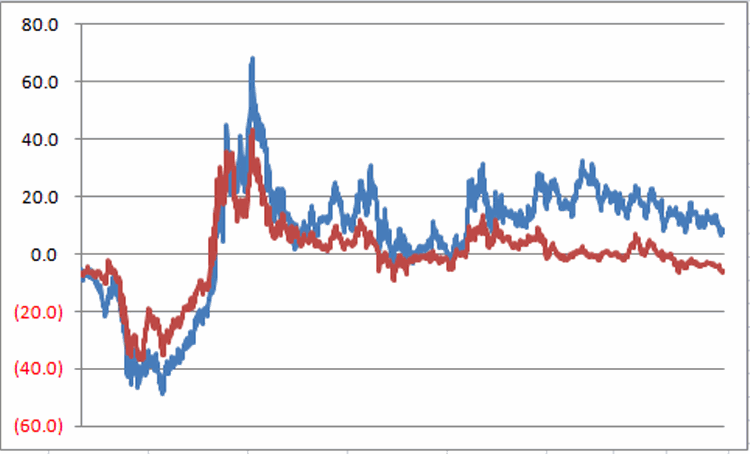
Figure 1 displays the SPY 252-day rate-of-change (Variable A) as the blue line and the HYG 252-day rate-of-change (Variable B) as the red line. 
Figure 1 – SPY (blue) and HYG (red) 252-day percentage rate-of-change; 4/11/2008 – 6/19/2015
When the blue line in Figure 1 is above the red line the system is long ULPIX and when the blue line is below the red line the system is in cash.
The Results
*Because HYG was outperforming SPY during most of 2008, this 252-day ROC method spent most of 2008 in cash and thus did not get clobbered during the great bear market of 2008 (although it did show a loss of -2.3% from 4/11/2008 through the end of the year).
*Over the next 6 calendar years (2009 through 2014) this system showed an average annual gain of +22.9% (respectable but still much less than the +41.2% average gin registered by the 44-day MA system discussed in Part 1).
*The system was in ULPIX 76.7% of the time and in cash 23.3% of the time.
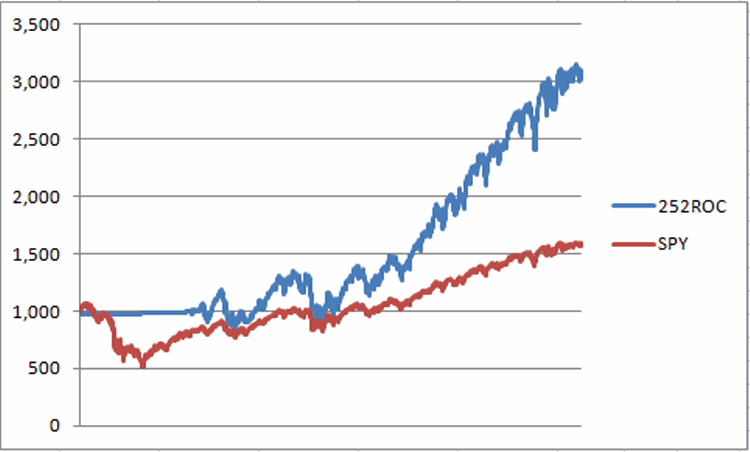
Figure 2 displays the growth of $1,000 using this system since 4/11/2008 as well as the growth of $1,000 placed into ticker SPY on a buy-and-hold basis.
Figure 2 – Growth of $1,000 using SPY/HYG 252-day ROC System (blue line) versus growth of $1,000 buying and holding SPY (red line); 4/11/2008 – 6/19/2105
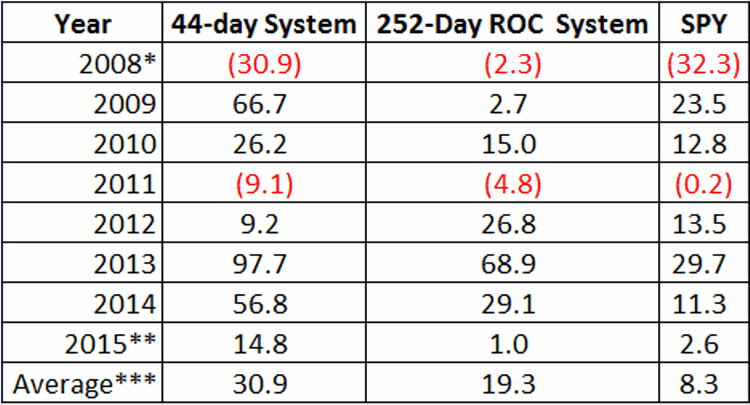
Figure 3 displays the annual returns for this system versus buy-and-hold.

Figure 3 – Annual Returns for 252-day ROC System versus buy-and-hold
*Starting on 4/11/2008
** – through 6/19/2015
***Average annual return 4/11/2008 through 12/31/2014
Summary
So at this point, if a trader wanted to choose one of the two systems (the 44-day ratio moving average system detailed in Part 1 or the 252-day ROC system detailed here), it is something of a “tortoise versus the hare” affair.
The 44-day ratio system made a lot more money, but also experienced more volatility and a much larger drawdown than the 252-day ROC system. It also trades much more frequently, which some may see as a positive and others as a negative.
Of course, who says you have to choose one or the other?
Stay tuned for Part 3.
