In my book Seasonal Stock Market Trends, I pulled a variety of well known (and not so well known) seasonal stock market trends (what else?) into a composite index referred to as the Known Trends Index”, or KTI for short. Sure, if I was a marketing guy I would’ve opted for something more along the lines of “Jay’s Hidden Order in the Stock Market Revealed” Index. Alas, the marketing gene apparently skips a generation in the Kaeppel Family.
The gist is this:
The KTI is comprised of 13 indicators (including The Election Cycle, Trading Days of The Month, Sell In May and Go Away, the Summer Rally, the 40-Week Cycle, the 212-Week Cycle, Trading around Holidays and 6 others, each with specific bullish, bearish or neutral criteria) and has historically ranged from a high reading of +8 to a low reading of -1.
Using the KTI to Trade
The more seasonal trends that are favorable at a given point in time the higher the KTI and vice versa. The theory is that higher KTI readings suggest more favorable conditions for the stock market than do lower KTI readings.
Does this theory hold true in reality? Take a look at Figures 1 and 2 and decide for yourself.
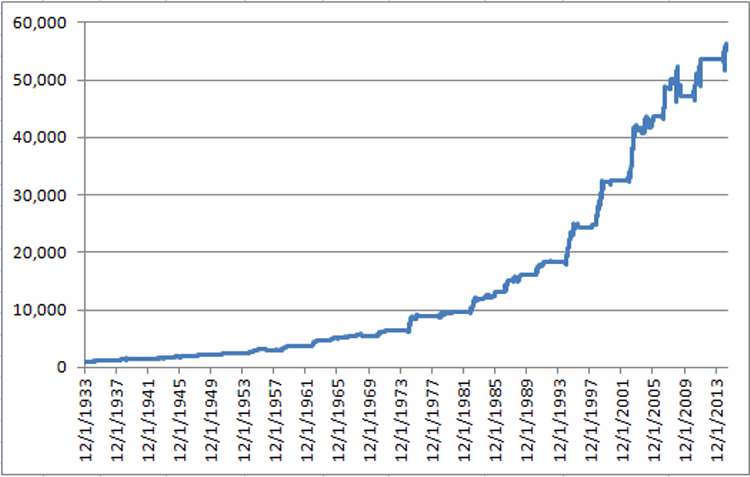
Figure 1 displays the growth of $1,000 invested in the Dow Jones Industrials Average (price only, no dividends included) only on those days when the KTI reads +5 or higher, starting on December 1st, 1933.
Figure 1 – Growth of $1,000 invested in Dow Industrials only when KTI >= +5; 12/1/1933 through 5/22/2015
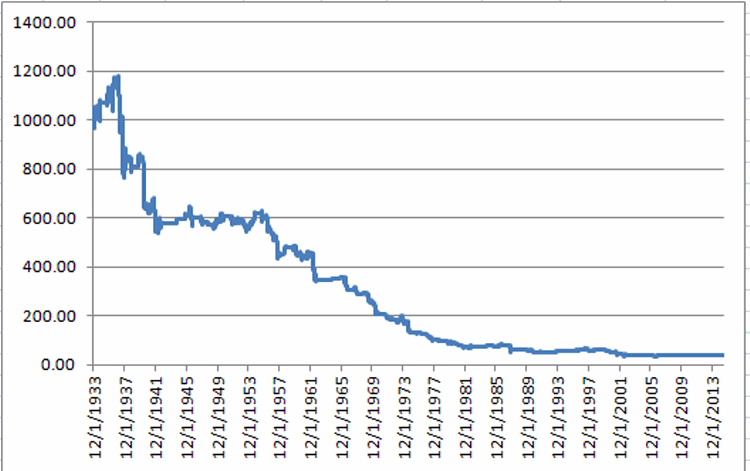
Compare and contrast the results displayed in Figure 1 to the results that appear in Figure 2. Figure 2 displays the growth of $1,000 invested in the Dow Jones Industrials Average (price only, no dividends included) only on those days when the KTI reads +1 or less, starting on December 1st, 1933.
Figure 2 – Growth of $1,000 invested in Dow Industrials only when KTI
For the record:
*$1,000 invested in the Dow only when the KTI >= +5 grew +5,470%
*$1,000 invested in the Dow only when the KTI
This dichotomy in performance is what we quantitative analyst types refer to in our highly technical terms as “statistically significant.”
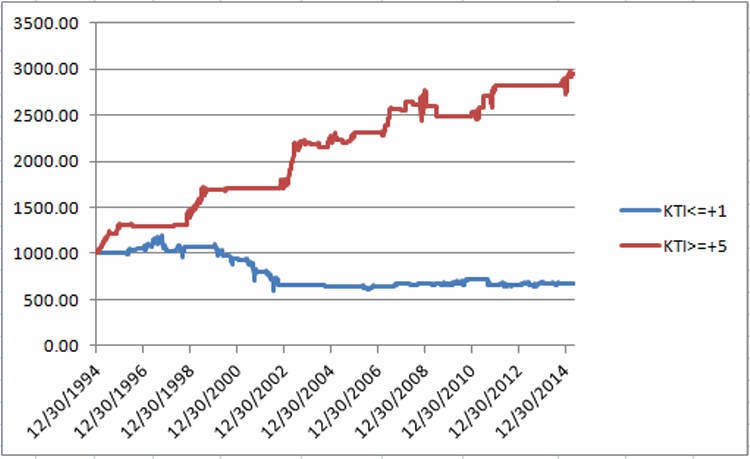
Under the category of “What have you done for me lately”, Figure 3 displays the results generated from holding the Dow Industrials when KTI >= +5 versus KTI 
Figure 4 – Growth of $1,000 invested in Dow Industrials when KTI>= +5 (red line) versus $1,000 invested in Dow Industrials when KTI
One problem with all of this information (going back to 1934) is that:
*The days for which the KTI >=5 represents only 14.65% of all trading days
*The days for which the KTI
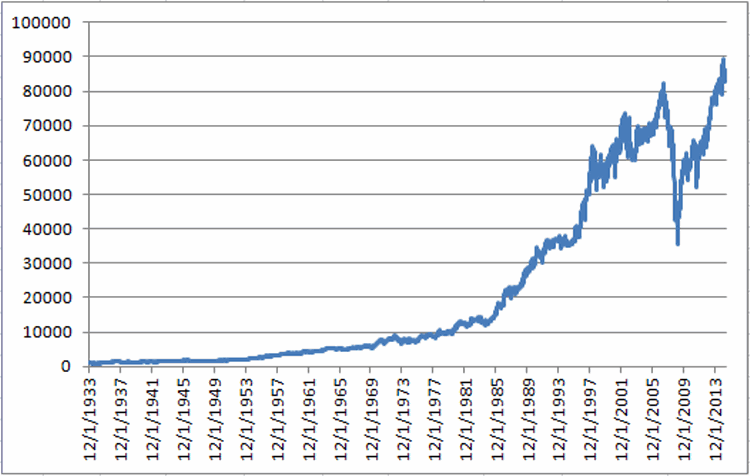
So what about all the other days? Figure 3 displays the performance of the Dow during all days since 12/1/1933 when the KTI was between +2 and +4.
Figure 3 – Growth of $1,000 invested in Dow Industrials only when KTI = +2 or +3 or +4; 12/1/1933 through 5/22/2015
*The good news is that the net gain was +8,500%. Which is what we quantitative analyst types refer to in our highly technical terms as “not too shabby.”
*The bad news is that investing only on days when the KTI read +2, +3 or +4 witnessed a drawdown of -38% in 1938 and a massive drawdown of -57% in 2008 (i.e., “Shabby”).
So how to put it altogether and actually trade?
Simple. Stay tuned for Part 2.
- See also Good News Bonds, Bad News Bonds

