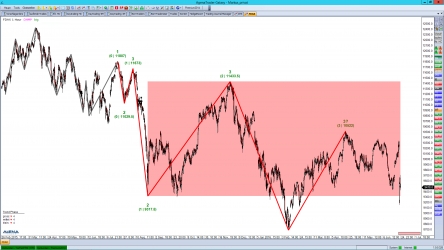
For experienced market participants, the price behavior on Friday last week was not exactly a surprise. Even if the 1000 point gap – triggered by the Brexit decision – was relatively high, from the point of view of the Dow Theory, it merely represents a movement in the direction of the trend.
Although the DAX was able to recover a little from the first shock, the main trend is still oriented short, meaning that we have to assume that we are headed for even lower lows in the coming week.
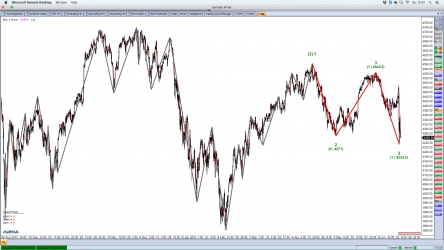
US trade did not remain unscathed by the Brits’ surprising decision either. The large trend in the hourly chart was still trendless up until the referendum result; then in the night of the announcement, the Nasdaq took a nosedive downwards and reached new lows at 4234 points, thereby installing a new downtrend.
Since this has just begun, we can expect this to continue for some time.
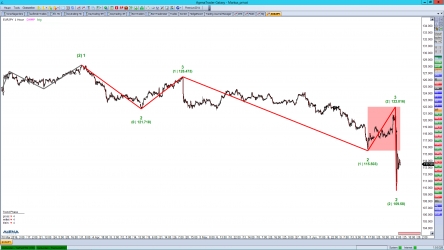
Once again, this currency pair is demonstrating the superiority of the Dow Theory. The euro had already been showing lasting weakness all week, and reached a new low at 150.50 JPY.
Following this, the market corrected to the last point two at 121.71 JPY, and formed a new corrective high at 122.01 JPY. Precisely at this point was where the first signs of weakness arose, and the Brexit decision then gave the price the final kick, pushing it back into the depths once more.
Only at 109.58 JPY did enough buyers come back into the market in order to support the price. Nevertheless, this trend also continues to point downwards.
BMW (DE:BMWG)
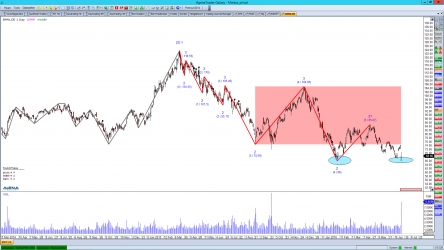
One of the largest car manufacturers worldwide, the Bayrischen Motorwerke, is indeed regularly able to show very good sales figures, but for months now the price has been painting a different picture.
In the chart we see a stable downtrend, which by now has become relatively mature. This maturity, in turn, provides hope for a bottom formation in the region of €66.-, particularly as there has already been large buying interest there for the third time now.
This value did not remain unaffected by the Brexit decision either, but the value was propped up at exactly €66.-. All in all, here we could see a good medium-term entry chance.
Disclaimer: Exchange transactions are associated with significant risks. Those who trade on the financial and commodity markets must familiarize themselves with these risks. Possible analyses, techniques and methods presented here are not an invitation to trade on the financial and commodity markets. They serve only for illustration, further education, and information purposes, and do not constitute investment advice or personal recommendations in any way. They are intended only to facilitate the customer's investment decision, and do not replace the advice of an investor or specific investment advice. The customer trades completely at his or her own risk.


