Get 40% Off
🚨 Volatile Markets? Find Hidden Gems for Serious OutperformanceFind Stocks Now

Traders: Time To Sell Stocks And Bonds, Buy Gold And Silver

Published 02/05/2015, 05:12 AM
Updated 07/09/2023, 06:31 AM

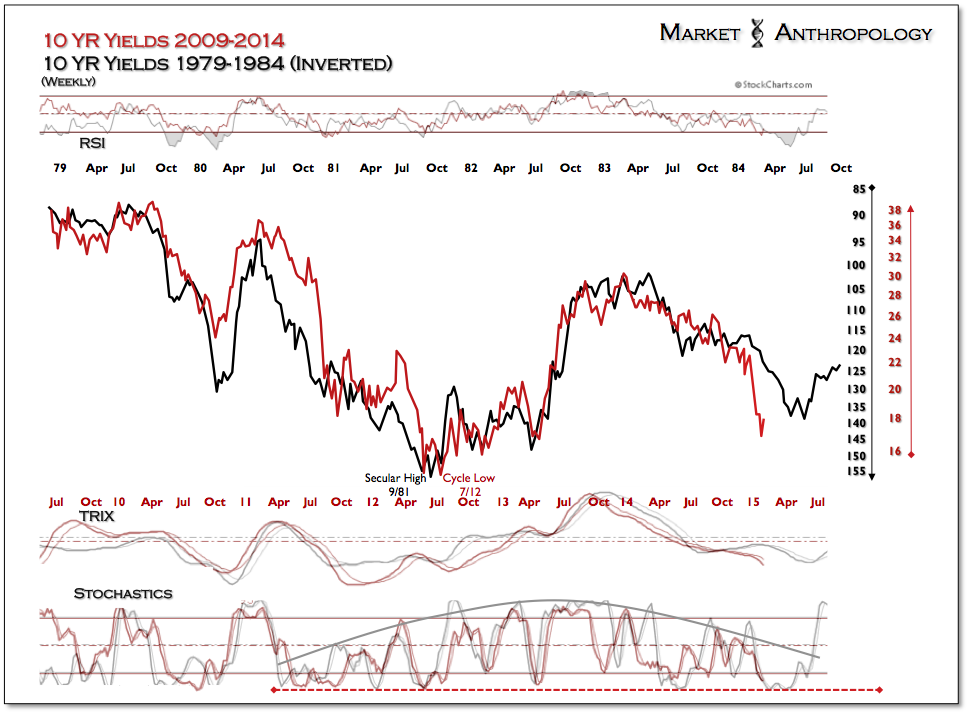
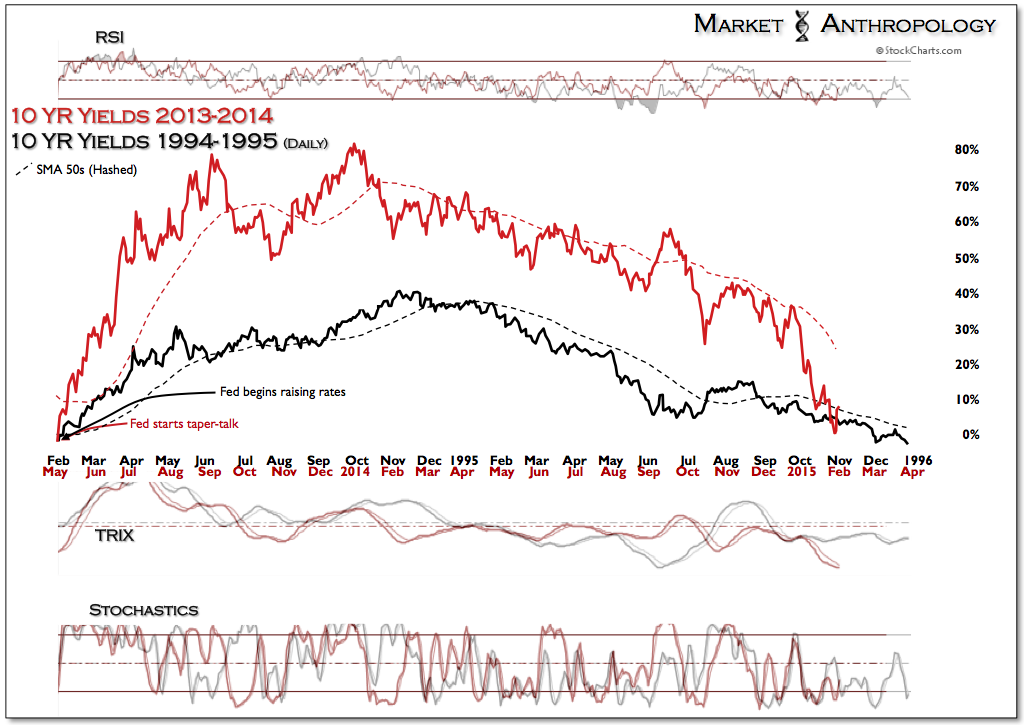
With consideration to our variant methodologies for establishing a context for the downtrend in long-term yields, we believe the move has reached the dregs of the trend. Over the past year, we've posted the following 10-Year yield charts ad infinitum, with the idea that long-term yields were poised to retrace a significant portion of the move that had reached a relative performance extreme at the end of 2013.
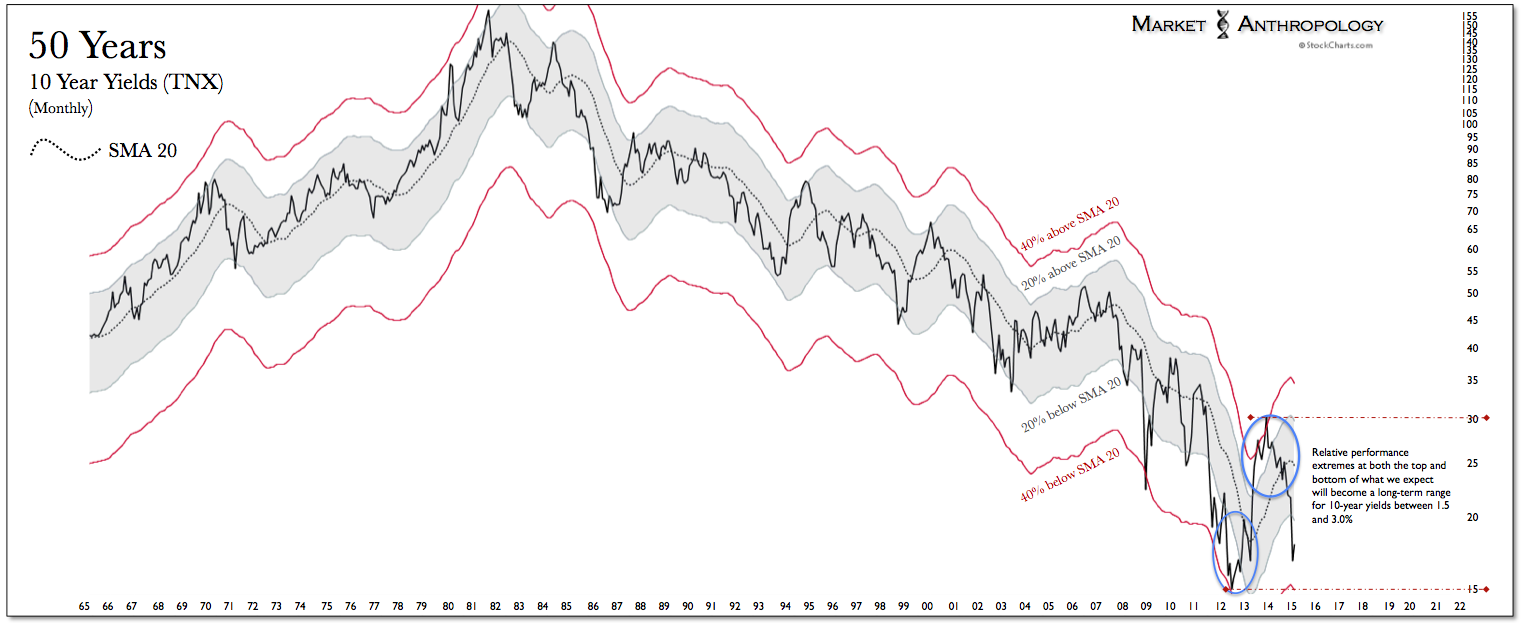
10-Y Yields, 50 Year Overview 10-Y Yields 2009-2014 vs 1979-1984 Inverted 10-Y Yields Daily: 2013-2014 vs 1994-1995

Last Friday, 10-year yields closed just 2 basis points higher (1.68%) than the May 1, 2013 close - which served as the power low for the subsequent taper-tantrum. From our perspective, the risk/reward for traders long Treasuries here is no longer compelling. Moreover - and as alluded to in recent notes, the significant move by the ECB last month to begin quantitative easing should provide further incentive and traction over an intermediate time frame away from the safe haven shores of long-term Treasuries.

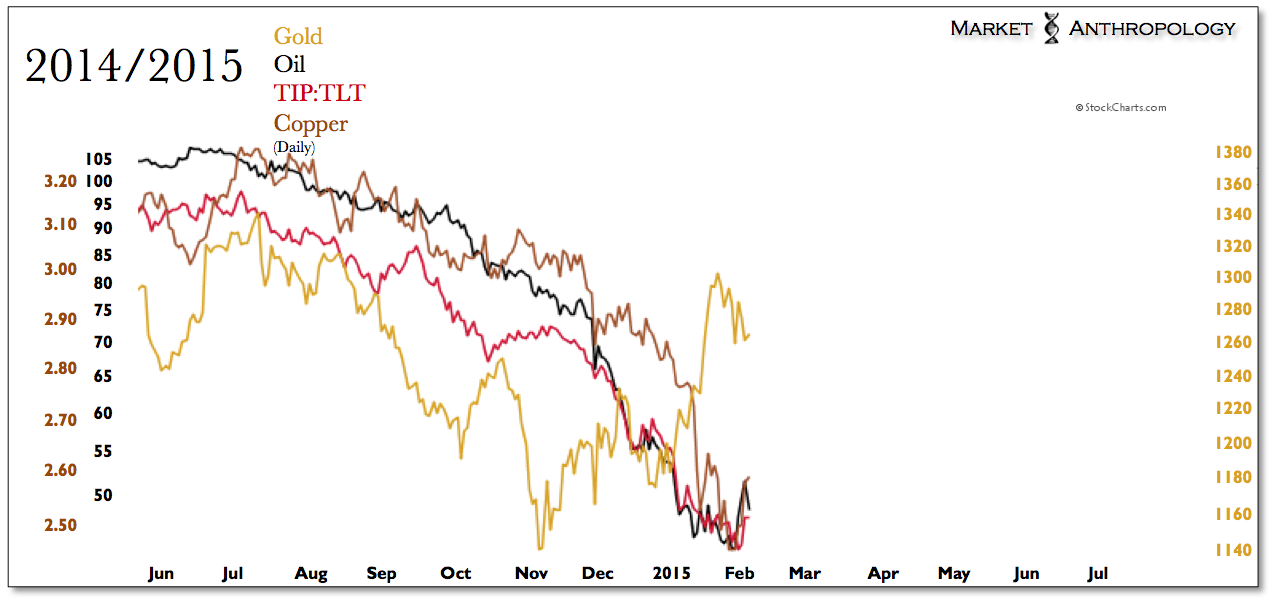
Upstream, we continue to find constructive action in burgeoning reflationary trends - namely, in gold and silver, that have led what we suspect will become a broader pivot in other downtrodden hard commodities such as oil and copper. We reiterate our call that TIPS look attractive relative to nominal Treasuries, with the more aggressive reflationary trade still found in silver rather than gold. On the immediate horizon, gold has become vulnerable to completing a quick retracement back to ~$1230, before we see it attempting to break out above its highs from last March and challenging its first major retracement level above $1400. In either scenario over the next week, precious metals remain one of our favorite positions and we would look to increase long-term allocations, primarily relative to U.S. equities - but also now with respect to long-term Treasuries as well.

Overall, the moves from the most recent deflationary scare have continued to follow the exhaustion sequence witnessed at the end of 2008, when a much larger deflationary squall hit the markets and inflation expectations. Despite the sharp retracement in equities this week, we are looking for the SPX to resume its downtrend - with a pivot inverse to what we expect will become a cyclical low in inflation expectations.
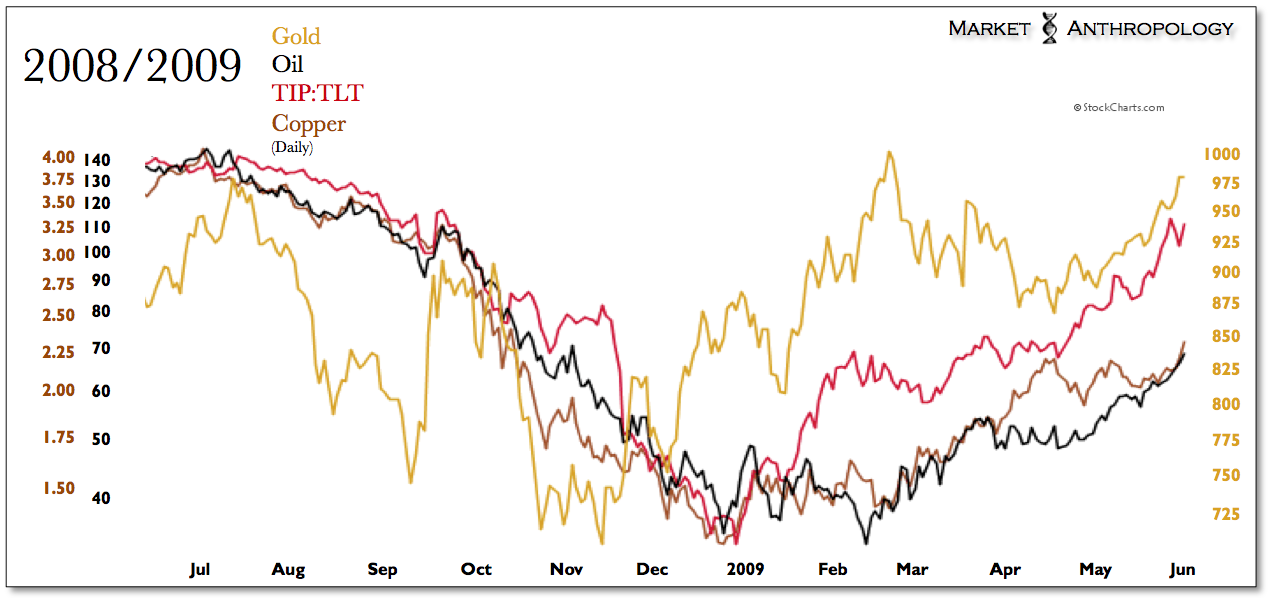
Gold vs Oil vs TIP:TLT vs Copper Daily: 2008/2009Gold vs Oil vs TIP:TLT vs Copper Daily: 2014/2015

3rd party Ad. Not an offer or recommendation by Investing.com. See disclosure here or remove ads .

Latest comments

Gold is still in a bear market. We are still on way down from 1900 and new lows will be coming. Gold has proven nothing yet and to put money there is a losing proposition. Stocks still have upside and pay dividends. Gold doesnt pay dividends and is only $100 off the low in the $1100's. Good luck if you sink your money into the yellow metal because you will be literally sinking!
Risk Disclosure: Trading in financial instruments and/or cryptocurrencies involves high risks including the risk of losing some, or all, of your investment amount, and may not be suitable for all investors. Prices of cryptocurrencies are extremely volatile and may be affected by external factors such as financial, regulatory or political events. Trading on margin increases the financial risks.
Before deciding to trade in financial instrument or cryptocurrencies you should be fully informed of the risks and costs associated with trading the financial markets, carefully consider your investment objectives, level of experience, and risk appetite, and seek professional advice where needed.
Fusion Media would like to remind you that the data contained in this website is not necessarily real-time nor accurate. The data and prices on the website are not necessarily provided by any market or exchange, but may be provided by market makers, and so prices may not be accurate and may differ from the actual price at any given market, meaning prices are indicative and not appropriate for trading purposes. Fusion Media and any provider of the data contained in this website will not accept liability for any loss or damage as a result of your trading, or your reliance on the information contained within this website.
It is prohibited to use, store, reproduce, display, modify, transmit or distribute the data contained in this website without the explicit prior written permission of Fusion Media and/or the data provider. All intellectual property rights are reserved by the providers and/or the exchange providing the data contained in this website.
Fusion Media may be compensated by the advertisers that appear on the website, based on your interaction with the advertisements or advertisers.
© 2007-2024 - Fusion Media Limited. All Rights Reserved.