Often times, young and middle-aged investors tend to focus on growth stocks, or stocks that focus on capital appreciation and tend to have low dividends. This is due to the logical reasoning that prevails in the minds of many that despite the fact that most growth stocks are ‘overvalued’, and usually do not pay dividends, the stock’s earnings are to grow faster relative to market indices like the S&P 500, or the DJIA.
This makes a lot of sense, and I agree with the idea behind investing in growth stocks; however when it comes to diversifying one’s portfolio, value stocks should not be overlooked. Most technology and computer companies are growth stocks, however, we are going to examine four small companies in that sector, or industry, and we are going to look at their prospects, financials, and outlook for the upcoming year.
The stocks we are going to examine include: ACI Worldwide Inc (NASDAQ:ACIW), Advent Software Inc (NASDAQ:ADVS)., Aspen Technology Inc (NASDAQ:AZPN), and finally, Check Point Software Technologies (NASDAQ:CHKP). These companies are all relatively small, but they could be interesting choices for investors looking for a bit more diversity in their technology holdings with a slightly more of a value approach:
ACI Worldwide
ACIW develops a line of software products and services, mostly zeroed in on facilitating electronic payments. In addition to its own products, it distributes, or acts as a sales agent for software developed by third parties.
These products and services are used principally by financial institutions, retailers, and electronic payment processors, both in domestic and international markets. Its products are sold and supported through distribution networks covering three geographic regions: the Americas, Europe/Middle East/Africa (EMEA), and Asia/Pacific.
ACIW Financials
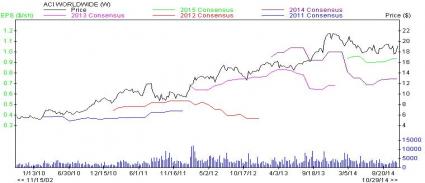
ACIW maintains a solid growing financial track record as can be seen from the charts below, and it currently retains an enterprise value that is a lot higher than the company’s market capitalization. ACIW’s forward P/E ratio is also lower than the industry’s average of 36.40, and the company’s PEG ratio is also far lower than the industry’s average of 2.29. These figures demonstrate why ACIW is a great value stock to hold onto, as ACIW’s stock holds more value than many others in the industry, while also giving the investor the most bang for his or her buck, at least on a growth basis.
Revenue, gross margins, profit, and EPS have all slowly increased, and ACIW just reported its earnings on October 30th before the market opened, and the company beat the Zacks EPS Consensus Estimate by $0.05, as well as revenue estimates, which were up 16.7% on a year/year basis. A graph showing how the company has been faring against Zacks EPS Consensus Estimates has also been provided below, and we can see how the company has sometimes beat EPS estimates.
| ACIW important Figures (Enterprise Value from Yahoo! Finance) | |||
| Market Capitalization (Billion) | $2.20 | ||
| Enterprise Value (Billion) | $2.90 | ||
| Forward P/E Ratio | 25.95 | ||
| PEG Ratio | 1.30 |
| 12/31/2013 | 12/31/2012 | ||
| Revenue (in millions) | $865.00 | Revenue (in millions) | $667.00 |
| Gross Profit (in millions) | $521.00 | Gross Profit (in millions) | $441.00 |
| Net Income (in millions) | $64.00 | Net Income (in millions) | $49.00 |
| Diluted Net EPS | 0.53 | Diluted Net EPS | 0.41 |
Advent Software
ADVS offers software and services, which automate work flows, and data across investment management organizations, as well as the information flows between an investment management organization and external parties.
Its business derives revenues from the development and sale software products, hosting services, data interfaces and related maintenance and services that automate and supports mission-critical functions of investment management organizations globally. Its Software-as-a-Service-based product offerings include Advent OnDemand, which includes its product offerings delivered over the web and hosted either by Advent or by a third party, and Black Diamond, which is available only over the web and hosted by Advent.
ADVS Financials
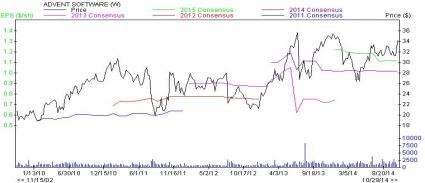
ADVS also maintains a solid growing financial record as can be seen from the charts below, and it currently retains an enterprise value slightly higher than the company’s market capitalization. ACIW’s forward P/E ratio is also lower than the industry’s average of 36.40. Revenues and gross margins have considerably increased, however, ADVS is ostensibly struggling to increase its profit and annual EPS. On the bright side, ADVS is the only stock out of these 4 value stocks to issue and pay dividends regularly, $0.13/share to be exact.
This may not be a lot, but a yield of 1.5% isn’t too shabby. A graph showing how the company has been faring against Zacks EPS Consensus Estimates has also been provided below, and we can see how the company has been beating the EPS estimates.. It is also worth mentioning that ADVS will be reporting earnings (expected) on the 2nd of February, 2015.
| ADVS important Figures (Enterprise Value from Yahoo! Finance) | |||
| Market Capitalization (Billion) | $1.77 | ||
| Enterprise Value (Billion) | $1.99 | ||
| Forward P/E Ratio | 31.76 | ||
| PEG Ratio | N/A |
| 12/31/2013 | 12/31/2012 | ||
| Revenue (in millions) | $383.00 | Revenue (in millions) | $359.00 |
| Gross Profit (in millions) | $263.00 | Gross Profit (in millions) | $236.00 |
| Net Income (in millions) | $29.00 | Net Income (in millions) | $30.00 |
| Diluted Net EPS | 0.54 | Diluted Net EPS | 0.58 |
Aspen Technology
AZPN is a global provider of process optimization software solutions, which are designed to manage and optimize plant and process design, operational performance, and supply chain planning. The company’s AspenONE software and related services have been developed specifically for companies in the process industries, including the energy, chemicals, and engineering, and construction industries.
The company has also developed its applications to design and optimize processes across the principal business areas: engineering, manufacturing, and supply chain. AZPN maintains three operating segments: license; software maintenance and support (SMS), training, and other professional services.
AZPN Financials
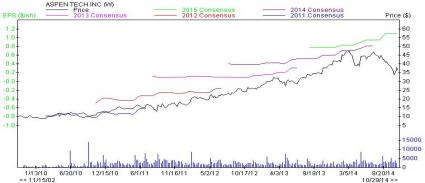
AZPN is also in a strong financial position, as can be seen from the charts below, and it currently retains an enterprise value slightly lower than the company’s market capitalization, indicating that it may be a little bit overvalued. However, AZPN’s forward P/E ratio is also lower than the industry’s average of 36.40. Revenues and gross margins have considerably increased, and AZPN is showing no struggle to increase its profit and annual EPS.
A graph showing how the company has been faring against Zacks EPS Consensus Estimates has also been provided below, and we can see how the company has somewhat been beating the EPS estimates with ease, while having an average positive surprise rate of +46.95%. It is also worth mentioning that AZPN will be reporting earnings (expected) on the 29th of January, 2015.
| AZPN important Figures (Enterprise Value from Yahoo! Finance) | |||
| Market Capitalization (Billion) | $3.29 | ||
| Enterprise Value (Billion) | $3.05 | ||
| Forward P/E Ratio | 31.85 | ||
| PEG Ratio | 2.45 |
| 12/31/2013 | 12/31/2012 | ||
| Revenue (in millions) | $391.00 | Revenue (in millions) | $311.00 |
| Gross Profit (in millions) | $339.00 | Gross Profit (in millions) | $261.00 |
| Net Income (in millions) | $86.00 | Net Income (in millions) | $45.00 |
| Diluted Net EPS | 0.92 | Diluted Net EPS | 0.47 |
Check Point Software Technologies
CHKP is an Israeli company that develops technologies to communications and transactions over the internet by enterprises and consumers. CHKP develops, markets, and supports a range of software, as well as combined hardware and software products and services for information technology (IT) security.
The firm offers its customers a portfolio of network and gateway security solutions, data and endpoint security solutions, and management solutions. Its solutions operate under unified security architecture. In 2011, CHKP introduced software blades, such as Application Control, URL Filtering, and an anti-bot software blade. CHKP derives its revenues mainly from products, licenses, combined hardware and software products, software updates and maintenance, and subscriptions.
CHKP Financials
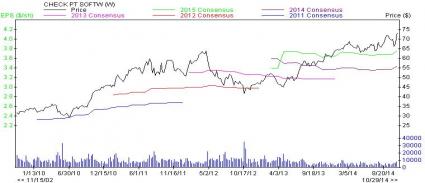
CHKP maintains a solid growing financial record as can be seen from the charts below, and it currently retains an enterprise value a lot lower than the company’s market capitalization, which like AZPN, may be a sign of overvaluation. CHKP’s forward P/E ratio is where the company really shines. It is so much lower than the industry’s average of 36.40, while revenues, gross margins, profits, and EPS have considerably increased.
A graph showing how the company has been faring against Zacks EPS Consensus Estimates has also been provided below, and we can see how the company has managed to beat EPS estimates. CHKP will be expected to report its earnings on the 27th of January, 2015.
| CHKP important Figures (Enterprise Value from Yahoo! Finance) | |||
| Market Capitalization (Billion) | $14.04 | ||
| Enterprise Value (Billion) | $12.54 | ||
| Forward P/E Ratio | 21.35 | ||
| PEG Ratio | 2.39 |
| 12/31/2013 | 12/31/2012 | ||
| Revenue (in millions) | $1394.00 | Revenue (in millions) | $1343.00 |
| Gross Profit (in millions) | $1232.00 | Gross Profit (in millions) | $1188.00 |
| Net Income (in millions) | $653.00 | Net Income (in millions) | $620.00 |
| Diluted Net EPS | 3.21 | Diluted Net EPS | 2.96 |
Bottom Line
It is hard to tell which one is the ultimate value stock, however CHKP seems to be carrying the lowest forward price-to-earnings ratio despite the fact that it is the only company out of all four to be sporting a Zacks Rank #2 (Buy), whilst all others are ranked #1 (Strong Buy). It also seems that CHKP is far larger than the other companies in terms of size and output, so it might be a safer choice.
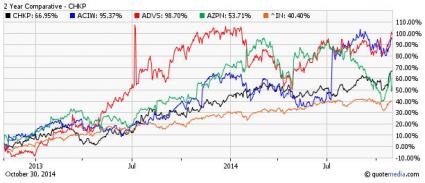
Still, it is always up to the investor to choose which one to stock up on, or if he chooses to diversify and stock on all four, however for dividend focused investors, ADVS seems like a solid choice from a yield look. Below is a comparison between how these stocks stack up against one another and against the S&P 500 index, as well.
Looking at the comparison, it seems that ADVS has had very strong growth, and the stock looks to be ripping higher heading in to 2015, while CHKP looks the most stable, and without too many fluctuations it is likely to continue its slow rise. AZPN and ACIW have seen lots of fluctuations, and perhaps it would be wise to stay away from them, and opt for ADVS (given the dividends), or CHKP as a true value stock for long-term value growth.