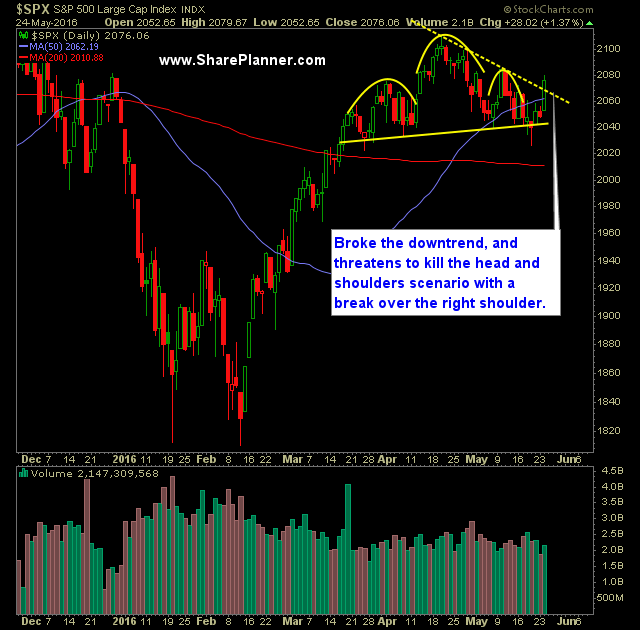
Technical Outlook- Massive, and very unexpected rally yesterday. The 5, 10, 20, and 50-day moving averages were smashed as if they didn't even exist.
- The biggest issue at hand here is that the bulls could violate and nullify the head-and-shoulders pattern by having price break above the right shoulder at 2084.
- The longer-term head-and-shoulders pattern on the weekly chart going back two years would be nullified on a move back above 2116.
- There is a lot at play here and a lot of potential to change the scope and shape of the market should this market continue rallying higher.
- With the choppiness this market has experienced over the last two years, there are a lot of conflicting patterns that have emerged. As crazy as it sounds, SPX going back to November of last year has formed an inverse head and shoulders, though it is a very sloppy one.
- Volume rebounded on SPY (NYSE:SPY) yesterday as it it jumped back to average levels after previously hitting yearly lows yesterday.
- Downward channel on the 30-minute chart and also seen on the daily chart was broken yesterday. As a result a higher-high was established.
- Favorable inventory report on oil suggests that oil could break $50 today, particularly if the 10:30 petroleum report is favorable.
- 2040-2138 price range on SPX continues to show just how difficult this price range is for trading, and over the last two years the price action has spent its time trading in it.
- VIX continues to struggle with a break over 16.40. It is a massive resistance level that is still a problem to any sustained downward momentum.
- It goes without saying that the two day price range that stocks were stuck in on the 5-minute chart between 2048 and 2055 was smashed at the open yesterday.
- Follow through is absolutely key today for the bulls. So much lately has resulted in next day reversals. A close higher today, would challenge that notion as SPX has closed down/up/down/up for eight straight sessions.
- The 50-week and 100-week moving average have crossed two weeks ago to the downside. Last time this happened was 2001 before the tech correction and again in June 2008 before the mortgage crisis saw its major correction.
- I believe at this point, profits have to be taken aggressively, and avoid the tendency to let the profits run - the market is in a very choppy range that has mired stock price for the past two years. Unless it breaks out of it and onto new all-time highs, then taking profits aggressively is absolutely important.
- Historically the May through October time frame is much weaker than the rest of the year.
My Trades:
- Added two new long positions yesterday.
- Covered (NASDAQ:QQQ) at 107.51 for a 2.3% loss yesterday
- Closed one additional trade yesterday.
- Currently 20% Long / 80% Cash
- I will look to add 1-3 new long positiosn to the portfolio today.
3rd party Ad. Not an offer or recommendation by Investing.com. See disclosure here or
remove ads
.

