Technical Outlook:
- Wild trading session yesterday, that saw price fluctuated between +13 and -13 on S&P 500, only to close at break even for the day.
- Volatility was created by the FOMC minutes that were released and the notable hawkish stance it took in raising rates - possibly as soon as June.
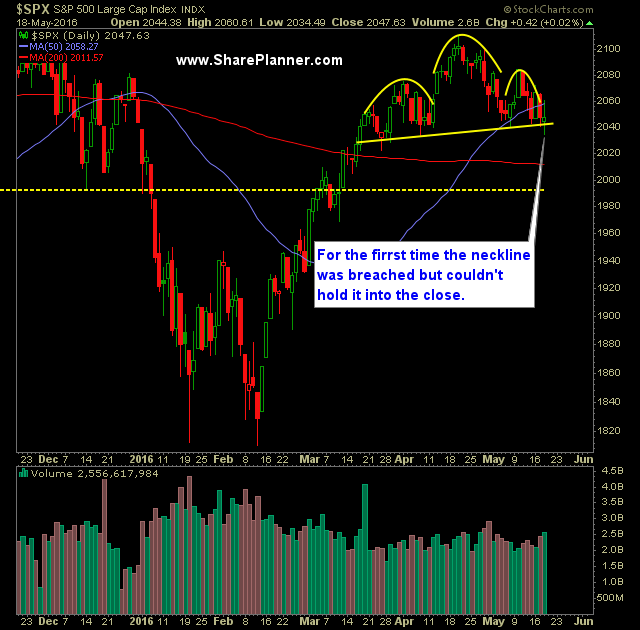
- Head and shoulders was not broken yesterday, despite a quick intraday dip below the 2039 price level.
- 2039 has been an incredibly difficult price level to break for the SPX. Beyond the H&S pattern, it has been a pivot level for the market in both terms of support and resistance over the past two years.
- SPX 30 minute chart continues to put in new lower-highs and lower-lows.
- VIX tested 16.40 yesterday, its breakout level, but was unable to break through it and hold it into the close.
- Oil showing some weakness today and yesterday, signaling a possible pullback at its current level.
- SPY (NYSE:SPY) volume increased again yesterday and was well above average levels of late.
- Most important for the bears today is whether the head and shoulders pattern is confirmed with a move below 2039 on the daily chart.
- This pattern has been in the making for about two months, and is a textbook pattern setup.
- For the bulls, the key will be to reverse this market and close above the 20-day moving average.
- The moving averages are all converging on current price action which is a sign of a market that hasn't moved any where in a couple of months.
- The last two times we saw this happen, a massive sell-off ensued (last August and December/January).
- If SPX manages to dip below 2040, the ability for the market to move in much bigger chunks in either direction becomes very possible.
- From 2040 to 2138 - you have a price range that is insanely choppy and continues to be such.
- The 50-week and 100-week moving average have crossed two weeks ago to the downside. Last time this happened was 2001 before the tech correction and again in June 2008 before the mortgage crisis saw its major correction.
- I believe at this point, profits have to be taken aggressively, and avoid the tendency to let the profits run - the market is in a very choppy range that has mired stock price for the past two years. Unless it breaks out of it and onto new all-time highs, then taking profits aggressively is absolutely important.
- Historically the May through October time frame is much weaker than the rest of the year.
3rd party Ad. Not an offer or recommendation by Investing.com. See disclosure here or
remove ads
.
My Trades:
- Covered Alphabet Inc (NASDAQ:GOOGL) yesterday at $721.01 for a 1% profit.
- Did not close any additional trades
- Added one additional short position yesterday.
- Currently 30% Short / 70% Cash
- Remain Long ProShares UltraPro Short S&P500 (NYSE:SPXU) (ETF that shorts SPX) at $28.30.
- Remain Short MA at $95.98 and one other stock.
- Looking to add more short exposure on a break of the neckline of the SPX head and shoulders pattern.
Chart for SPX:
