Get 40% Off
🚨 Volatile Markets? Find Hidden Gems for Serious OutperformanceFind Stocks Now

SPX Under Key Resistance

Published 10/27/2015, 08:15 AM
Updated 07/09/2023, 06:31 AM

Technical Outlook:

  • SPX 2079-80 offering some resistance with price consolidating just underneath.
  • Support for now appears to remain solid above the 200-day moving average.
  • Opening/Closing prices of the past two trading sessions continue to remain tightly bound to each other.
  • Volume was extremely light on SPDR S&P 500 (N:SPY) yesterday, and well under half of what we have seen the last two trading sessions.
  • This is FOMC week. While I don't expect them to raise rates, the market may continue in a holding pattern until an announcement comes out.
  • VIX rallied for a second straight day, finishing 5.7% higher at 15.29.
  • After a hard rally on SPX 30 minute chart, nice bull flag pattern forming.
  • Despite the rally of the past two days and the week prior, the T2108 (% of stocks trading above the 40-day moving average) has completely flat-lined. I am watching for a downside break at this point below 55% (currently at 65%). The flat-lining indicator is a major divergence against this market rally.
  • Ultimately, price on SPX is entering a range that has notoriously been difficult trading for most and one that vacillates consistently within a narrow range.
  • 10-day moving average continues to be a strong barometer of market direction - a close below it would represent a significant market reversal.
  • The Fed has never raised interest rates at a point where the market was trading lower on the year. Currently, SPX is trading in positive territory heading into Wednesday's announcement.


My Trades:

  • Did not add any new swing positions yesterday.
  • Sold N:MFC yesterday at 16.81 - flat trade.
  • 20% Long / 80% Cash
  • Remain long: N:DIS at $105.88, N:MSI at $70.66
  • Will look to add 1-2 new long positions today on continued market strength.
3rd party Ad. Not an offer or recommendation by Investing.com. See disclosure here or remove ads .

Chart for SPX:
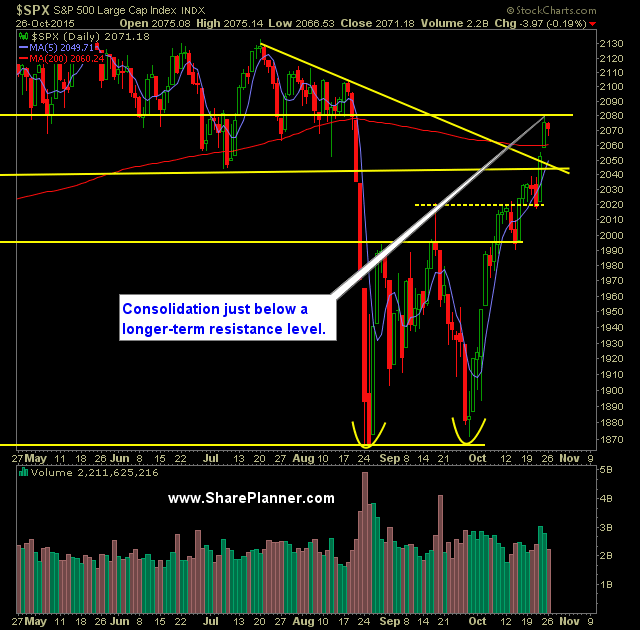
SP 500 Daily Chart

Original post

Latest comments

Risk Disclosure: Trading in financial instruments and/or cryptocurrencies involves high risks including the risk of losing some, or all, of your investment amount, and may not be suitable for all investors. Prices of cryptocurrencies are extremely volatile and may be affected by external factors such as financial, regulatory or political events. Trading on margin increases the financial risks.
Before deciding to trade in financial instrument or cryptocurrencies you should be fully informed of the risks and costs associated with trading the financial markets, carefully consider your investment objectives, level of experience, and risk appetite, and seek professional advice where needed.
Fusion Media would like to remind you that the data contained in this website is not necessarily real-time nor accurate. The data and prices on the website are not necessarily provided by any market or exchange, but may be provided by market makers, and so prices may not be accurate and may differ from the actual price at any given market, meaning prices are indicative and not appropriate for trading purposes. Fusion Media and any provider of the data contained in this website will not accept liability for any loss or damage as a result of your trading, or your reliance on the information contained within this website.
It is prohibited to use, store, reproduce, display, modify, transmit or distribute the data contained in this website without the explicit prior written permission of Fusion Media and/or the data provider. All intellectual property rights are reserved by the providers and/or the exchange providing the data contained in this website.
Fusion Media may be compensated by the advertisers that appear on the website, based on your interaction with the advertisements or advertisers.
© 2007-2024 - Fusion Media Limited. All Rights Reserved.