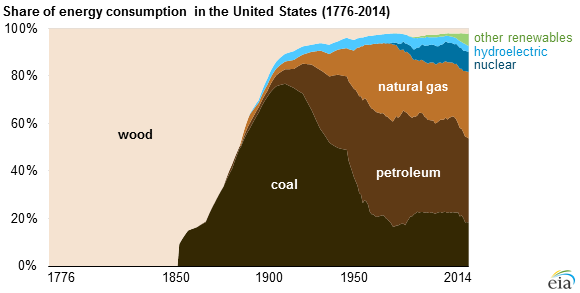
The U.S. Energy Information Agency (EIA) produces a wealth of information on a wide range of energy-related issues. It’s interesting to look at some charts over a longer perspective to see how sources of energy have changed. Prior to 1850, virtually all the energy we consumed came from burning wood. From around 1850, coal quickly gained importance, as the industrial revolution took hold and productive output shifted to factories and mass production. Petroleum gained share along with the automobile, and in the last few years, it’s possible to see the growing importance of natural gas, as it has begun to supplant coal in the generation of electricity.
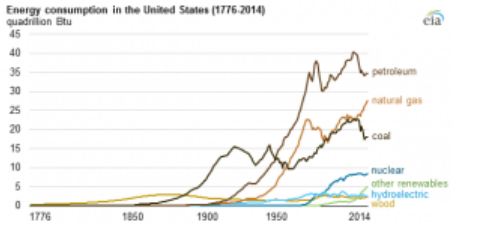
The second chart shows actual energy consumption, and here, the gains of natural gas at the expense of coal can be seen more clearly. It places the shale revolution in an Energy Consumption US historical context. Our use of natural gas has been increasing, but our use of petroleum has, if anything, decreased in the past several years. However, the big story here is our decreasing reliance on imports. The EIA’s Annual Energy Outlook forecasts that the U.S. will stop being a net energy importer in 2028 in their Reference Case. There are various other scenarios incorporating faster or slower economic growth and domestic crude oil production that move this milestone anywhere from 2019 to 2040. There’s little doubt, though, that shale production, with its associated demand for increased energy infrastructure, remains a major story.

Crude oil stocks continue to rise, as domestic production defies forecasts of a price-induced slump. Stocks recently reached a new high of just over 1.25 billion barrels, slightly more than two months of normal use (mostly by refineries). Storage facilities remain in high demand. For example, Magellan Midstream (NYSE:MMP) recently announced plans to build a new 700,000 barrel storage complex near Houston, TX. Demand for crude oil tankers remains strong. Crude is in contango (forward prices are higher than spot), which can make it profitable to hold crude oil for future delivery if the storage costs can be covered, and in some cases oil tankers act as temporary floating storage.

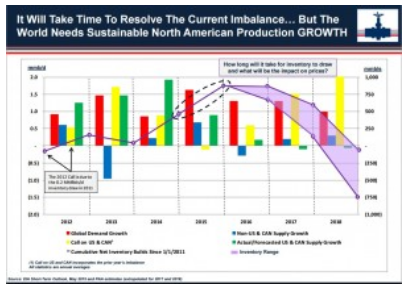
The storage overhang is one reason why Plains All America (NYSE:PAA) in a recent investor presentation argued that crude prices were unlikely to move up substantially until the current high levels of storage are worked off, a process that could take another couple of years. Over the longer run though, they believe increased U.S. output is the solution to meet growing global demand.
This is all interesting stuff, and yet the most common questions I received this past week were why are MLP prices falling and when will they stop. The Alerian MLP Index was down 11% for the first half of the year, and the yield on the index has now risen above 6.5%, which looks pretty attractive in our opinion. The preceding slides and narrative, of course, don’t speak to the market’s near term direction. The fundamentals of the shale revolution remain fascinating and positive for MLPs, but that provides little help on where things will go next week. Over the next month or so, quarterly earnings will be released for many businesses, and this will at least provide a useful update to growth prospects within the industry. It’ll represent a helpful update on energy infrastructure fundamentals to overlay on the recent weakness in financial markets.
We are invested in MMP and PAA.
