Yesterday I wrote about the crowded short trade that boosted energy futures 40-50% from the lows of only a few weeks ago. A related crowded trade was the short-inflation trade, and it also was related to carry.
TIPS, as many readers will know, accumulate principal value based on realized inflation; the real coupon rate is then paid on this changing principal amount. As a rough shorthand, TIPS thus earn something like the real interest rate plus the realized inflation (which goes mainly to principal, but slowly affects the coupon over time). So, if the price level is declining, then although you will be receiving positive coupons your principal amount will be eroding (TIPS at maturity will always pay at least par, but can have a principal amount less than par on which coupons are calculated). And vice versa, of course – when the price level is increasing, so does your principal value and you still receive your positive coupons.
This means that, neglecting the price change of TIPS, the earnings that look like interest – those paid as interest, and those paid as accumulation of principal, which an owner receives when he/she sells the bond or it matures – will be lower when inflation is lower and higher when inflation is higher. It acts a little bit like a floating-rate security, which is one reason that many people believe (incorrectly) that FRNs (floating rate notes) hedge inflation almost as well as TIPS. They don’t, but that’s something I’ve addressed previously and it’s not my point today.
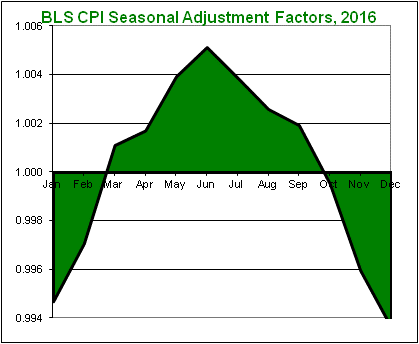
My point is that TIPS investors behave as if this carry is a hot potato. When carry is increasing, everyone wants to own TIPS; when carry is decreasing no one wants to own TIPS. The chart below (Source: BLS) shows the seasonal adjustment factor used by the Bureau of Labor Statistics to adjust the CPI. The figure implies that prices tend to rise into the summer and then decline into year-end, compared to the average trend of the year, so we should expect higher increases in nonseasonally-adjusted CPI in the summer and lower increases or even outright decreases late in the year.

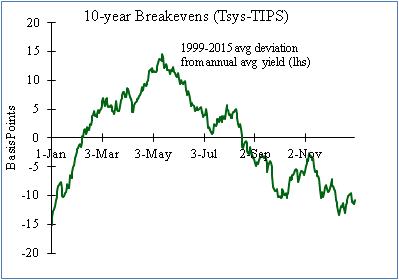
Now, the next chart (Source: Enduring Investments) shows what 10-year breakevens have done over the last 16 years, on average, compared to the year’s average.

Do these two pictures look eerily similar?
From a capital markets theory perspective, this is nuts. It says that breakevens expand (TIPS outperform) when everyone knows carry should be increasing, and narrow (TIPS underperform) when everyone knows carry should be decreasing.
And from a P&L perspective, a 30bp increase in 10-year breakevens swamps the change in accruals that happens as the result of seasonal changes in CPI. Moreover, these are known seasonal patterns; one should not be able to ‘outsmart’ the market by buying breakevens in January and shorting them in May. Theory says that while you’re owning negative carry, you should make it up in the rise of the price of the bond to meet the forward price implied by the carry. Nevertheless, for years you were able to beat the carry, at least if you were a first mover. (Incidentally, an investor doesn’t try to beat the average seasonal, but the actual carry implied by movements in energy too – which are also reasonably well-known in advance).
But as liquidity in the market has suffered (not just in TIPS, but in many non-benchmark securities, thanks to Dodd-Frank and the Volcker Rule), it has become harder for large accounts to do this. More importantly, the market has tended to drastically overshoot carry – either because less-sophisticated investors were involved, or because momentum traders (aka hedge funds) were involved, or because investor sentiment about inflation tends to overshoot actual inflation. Accordingly, as energy has fallen over the last year-and-a-half, TIPS have gotten cheaper, and cheaper, and cheaper relative to fair value. In early January 2015, I put out a trade recommendation (to select institutional clients) as breakevens were about 90bps cheap. The subsequent rally never extinguished the cheapness, but it was a profitable trade.
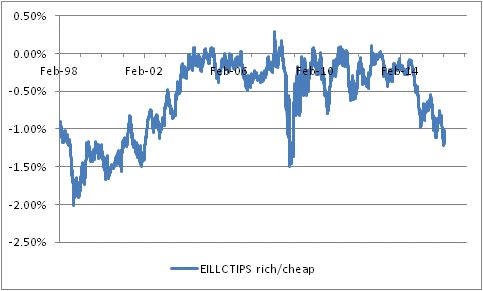
On February 11th of this year, TIPS reached a level of cheapness that we had only seen in the teeth of the global financial crisis (ignoring the period prior to 2002, when TIPS were not yet a widely-held asset class). The chart below shows that TIPS recently reached, by our proprietary measure, 120bps cheap.

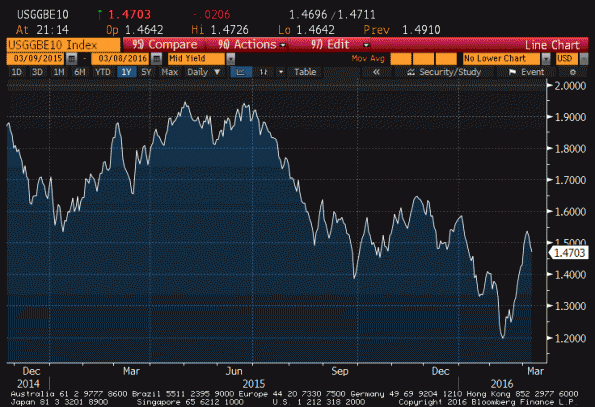
But, as with energy, the short trade was overdone. 10-year breakevens got to 1.20% – an almost inconceivable level that would signal a massive failure not only of Fed policy, but of monetarism itself. Monetarism doesn’t make many claims, but one of these is that if you print enough money then you can create inflation. Since then, as the chart below (source: Bloomberg) shows, 10-year breakevens rallied about 35 bps before falling back over the last couple of days. And we still show breakevens as about 100bps cheap at this level of nominal yields.

Yesterday I noted that the structural negative carry for energy markets at present was likely to limit the rally in crude oil, as short futures positions get paid to stay short. But this is a different type of carry than the carry we are talking about with TIPS. With TIPS, the carry is caused by movement in spot energy (mostly gasoline) prices; with crude oil markets, the carry is caused by rolling futures positions forward.
The TIPS carry, in short, will eventually stop being so miserable – spot gasoline is unlikely to continue to decline without bound. But even if spot gasoline stabilizes, short futures positions can still be profitable if oversupply into the spot market keeps futures curves in contango. Accordingly, while I think energy futures will slip back down, I am much more confident that TIPS breakevens have seen the worst levels we are likely to see.
Unfortunately, for the non-institutional investor it is hard to be long breakevens. The CME has never re-launched CPI futures, despite my many pleadings, and most ETF products related to breakevens have been dissolved – with the notable, if marginal, exception of the ProShares 30 Year TIPS/TSY Spread (NYSE:RINF), which tracks 30-year breakevens but has a very small float. It appears to be approximately fair, however. Other than that – your options are to be long a TIPS product and long an inverse-Treasury product, but the hedge ratios are not simple, not static, and the fees would make this unpleasant.
However, as I wrote recently, what this means for the individual investor is that there is no strategic reason to own nominal bonds now. If I own nominal Treasury bonds, I would be moving into TIPS in preference to such a low-coupon, naked-short-inflation-risk position.
