The Hoot
Actionable ideas for the busy trader delivered daily right up front
- Thursday uncertain.
- ES pivot 1845.92. Holding above is bullish.
- Friday bias uncertain technically.
- Monthly outlook: bias lower.
- YM futures trader: N:VZ not a swing trade buy.
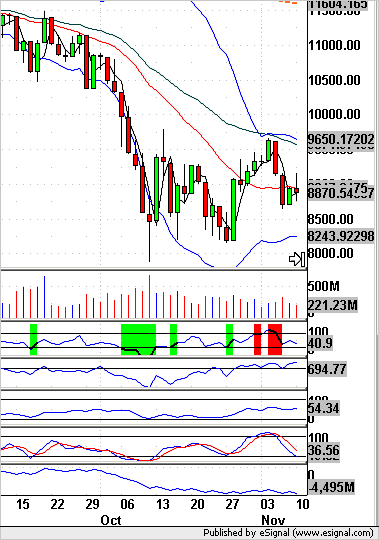
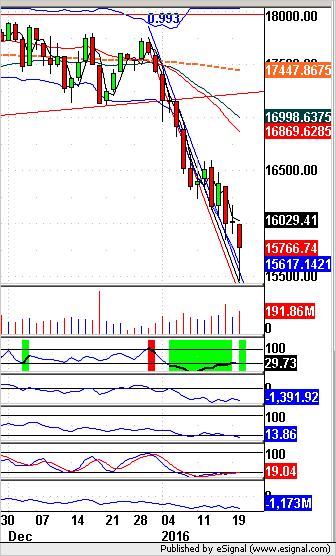
OK, so we all know what happened on Wednesday - it was Stockopalypse Now. I've been resisting the temptation to compare this to 2008 because everyone's been saying how this isn't 2008. Then I got one of those emails from one of my brokers today about how it was important to stay the course and not to panic, etc. The last time I got one of those was in, yes, 2008. So let's take a good look at the bogeyman 2008. Here he is, on the left.


OK, and then here's today's action on the right. (Click to enlarge, as they say). Take a look at the action of October 2008 compared to January 2016. The similarities are striking, I'd say.
OK, so in the meantime, let's see where the world is going on Thursday, before it comes to a sudden and awful end.
The technicals
The Dow: The Dow's monthly low close of last August was 15,666 (interesting how that 666 keeps coming up, isn't it? 666 was also the SPX low in 2009). On Wednesday we retested that low, successfully as it turns out. The resulting candle was a fat hammer, the biggest we've seen this year so far, and on heavier than normal volume. If you don't believe the Dow will hit zero in April then you must believe there comes a point when all the margin calls have been satisified, all the scaredy cats have fled, and all the shorts have shorted all they dare. I don't know if Wednesday was capitulation, but the headlines in the paper and on the TV news were all about the stock market. And that's always a good sign the bottom is near. Of course when we get into these sorts of death spirals, we have to see confirmation so I can't call it just yet.
The VIX: I was thinking the VIX might go lower on Wednesday, but instead it gained nearly 6% on a giant lopsided long-legged doji star that tested its upper BB before falling back. Once again the upper BB proved to be the third rail of the VIX. With two thirds of a bearish evening star now in place I'm thinking this could be a sign that the VIX moves lower on Thursday.
Market index futures: Tonight, all three futures are higher at 12:34 AM EST with ES up 0.08%. Mr. Market must have had an excellent lunch on Wednesday because shortly after 12:30 PM the market began reversing its ugly declines of the morning with ES ending the day on a very tall classic hammer. This candle also marked the second day trading outside the year-long descending RTC and that qualifies as a bullish trigger. Whether or not that actually means anything remains to be seen. However we note that the new overnight is trading non-trivially higher. Also the indicators all continue slowly but steadily rising off of oversold and that eventually has to count for something.
ES daily pivot: Tonight the ES daily pivot rises again from 1878.92 to 1845.92. That again places ES back above its new pivot so this indicator continues its flip-flopping, this time back to bullish.
Dollar index: Last night the dollar disconfirmed Tuesday's dark cloud cover by gaining 0.14% on a small doji star. Indicators remain overbought but the action over the past week has been herky jerky and therefore I just can't come up with a valid reason to call it one way or the other tonight.
Euro: And it's pretty much the same story with the euro which seems to be stuck lately in a congestion range between the area of 1.086 and 1.096. The indicators are pretty much all just moving sideways so they are no help. And the bottom line here is that I am not touching this chart either tonight.
Transportation: In something of an odd bullish divergence of sorts, on Wednesday the trans lost only 0.48%, in other words, three times better than the performance of the Dow. The resulting candle was a very long-legged doji star on increased volume. Indicators remain oversold so the next move could just possibly be higher although given the performance year to date this requires confirmation.

Tonight we have a successful retest of the August lows and big hammers on the charts, usually good reversal signs. But the prevailing sentiment has been just so awful for so long lately that I'm leery of calling the market higher. I'd say we're overdue for a reversal but none of the reversal signs has been panning out all year so far. We're also not close enough to the ES pivot to make a conditional call so I guess all that leaves is Thursday uncertain.
YM Futures Trader
Ugh. Don't even ask.
