Since June 2012, the major stock indexes have soared sharply higher. Important stock indexes such as the Dow Jones Industrial Average, the S&P 500 and the Russell 2000 have made new all-time highs. The Dow Jones Transportation Index also climbed to all-time highs, which can be seen in the iShares Dow Jones Transportation ETF (IYT). Each of these moves to new highs indicate strength in the stock market. So now that we know the market is strong, how do we know when a top is in place?
Three Signs Of A Top:
- The public finally gets involved in stocks. In case you have not noticed, the trading volumes on the SPDR S&P 500 Trust (SPY) have been extremely light over the past couple of years. This tells us that the market is moving higher by predominantly just institutional participation. If the trading volume was higher it would signal that the public is actually involved in the stock market. When the public starts to tout stocks and indexes the way they where touting Apple Inc. (AAPL) when it was trading around $700 a share it tells us that the top is near. The vast public will notoriously jump into the market at the very end of the run.
- Leading stocks begin to make lower highs. When the bulk of the leading stocks begin to make lower highs on the charts it is telling us that the current leadership can no longer hold up. Now, many people will tell you that this is just sector rotation, but that is why you want to follow all of the leading stocks in different sectors. When they start to give way it is telling us that the institutional leadership is leaving the market. Remember, it is the institutional money that moves markets not the public with an E-Trade account.
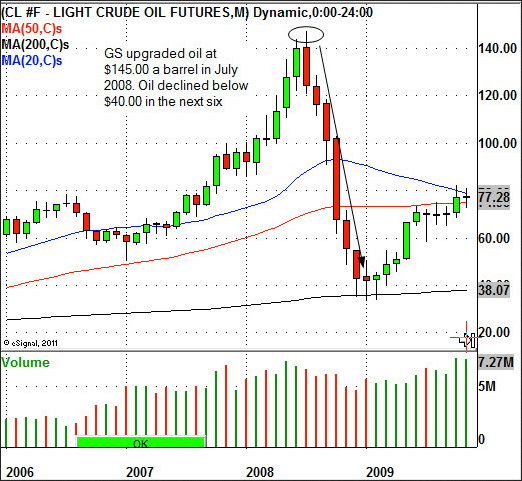
- Extreme optimism and upgrades by the large too big to fail financial firms. Whenever the large financial firms continue to pump the markets by saying it a buying opportunity it is often a top. Just look at the track record of these people. In September 2011, gold was upgraded by J.P. Morgan Chase & Co. (JPM) to $2500 an ounce. As you know, gold topped out in September 2011 and has been in correction mode since that time. In July 2008, Goldman Sachs Group Inc. (GS) upgraded light sweet crude to $250 a barrel. At that time, oil was traded around $145 a barrel. Oil plunged lower a few days later after the upgrade. Six months from that highly touted upgrade on oil it plunged below $40 a barrel. This is why investors should learn to use the charts and forget what the talking heads have to say.