The September ending quarter is now in the history books. Investors will soon be receiving their quarterly portfolio reports in the mail and grinning from ear to ear over their gains for nine months. The Dow Jones Industrial Average is up 5.1% for the year. Both the Nasdaq and the S&P 500 are up 6.1% for 2016, as of the end of September.
What’s not to like? As long as you look in the backwards direction, you may continue smiling, but if you look forward, you might be disturbed by what analysts, even the ones that are normally positive and optimistic, are saying about the last quarter of 2016.
Central bankers got us into the present market mess, and their banking brethren are not doing much in the way of helping either. Add current events to a super nasty presidential election in the U.S., and you have a brewing recipe for disaster on all fronts. Yes, the negative crowd has finally put a pale on even the most optimistic forecast for equities over the next three months.
Volatility will certainly spike as Election Day in November draws near, but a potential rate hike by the Fed in late December will continue the uncertainty and, according to naysayers, will put a bullet in this Bull market’s head.
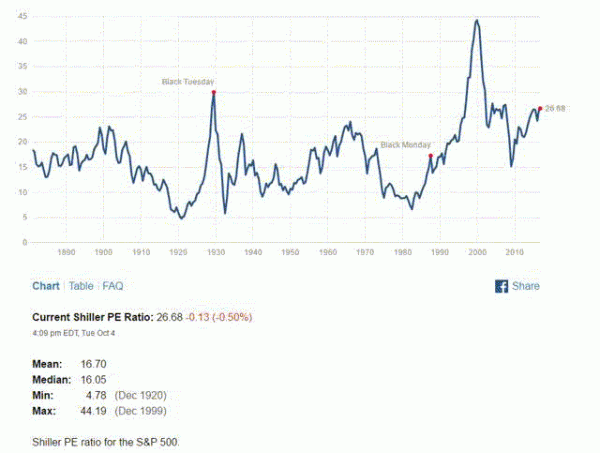
Pundits are once again pointing to the Shiller PE Ratio and its portrayal of bad times on the near-term horizon:
The current data point is high by any measure. It suggests that a near 27 multiple of adjusted earnings for valuations of S&P 500 participant stock issues is way too high for comfort. The current territory was last traversed right before the Great Recession unfolded.
If investors unwarily believe that the gains depicted on their current portfolio reports are an indication that more buying is in order, then this chart value can only increase over time. Their enthusiasm may soon, however, be dampened by press hysteria concerning whether the Fed will actually follow through on its rate hike plans.
Make no mistake about it -- Bankers are not our friends!
It is no mystery as to why investors have created a “bubble” in asset valuations the world over. 2016 began with a downdraft in Chinese equities. Global central bank policy of paper money value dilution, coupled with near-zero to negative interest rates, has driven capital away from savings into whatever can produce a decent return, regardless of the risk. As a result, equity markets have been the ultimate beneficiaries of cheap money.
To compound the situation even further, corporations have shunned investments for more equipment and jobs and piled available funds into stock buy back programs. The reason is simple. Executive management bonuses are tied to stock appreciation, an easy variable to manipulate when you can reduce outstanding shares on a whim.
It remains to be seen how central bankers will unravel this market mess, but, when asked, the answer is always gradually over anywhere from five to eight years. Janet Yellen recently gave her critics more ammunition, when she said she might consider buying stocks, as if that ploy would stall a collapse in fairytale valuations.
Stock markets will not wait that long to correct. 2017 has already been forecast to be rife with troubled waters, but, if the Fed re-launches its normalization scenario in December, we can only wish for some other positive December surprise to bolster stock values for a few more months, at best. Sooner or later, the doom and gloomers will finally hit the nail on the head. Stocks will fall, and global liquidity will suffer in the balance.
Central banks, however, are not the only problem in the banking community. Deutsche Bank AG (DE:DBKGn) NA O.N. (NYSE:DB) and Wells Fargo (NYSE:WFC) seem to be doing their level best to roil their own critics into a frenzy. The former has been known to take on far too much risk in its growing portfolio, including the largest overhang in the derivatives market of any major bank on the planet.
The U.S. Justice Department recently fired its first round over the Deutsche Bank bow, when it threatened the bank with a $14 billion fine. On the other front, Wells Fargo’s fraudulent bank account scandal has drawn a raft of reprimands and recriminations from every quarter, despite its attempts to pay fines and dismiss its bad behavior.
The remainder of major banking institutions have also reeled from the onslaught of billions in fines over the past decade for its transgressions during the Great Recession and beyond, including a massive scandal in fixing both foreign exchange and Libor rates for personal advantage.
Despite Dodd-Frank and other global legislation designed to a halt risky behaviors, these banks continue to act as if they have created a new economic model, the constant trading of global bond issues on the casino of their own making. Prices for these obscure issues do not reflect true market forces, but are determined via sophisticated academic pricing models.
It might come as a surprise to many, but our global bond markets are twice the size of our equity markets. The S&P 500 Index has been flat for months, but long-term interest rates have been falling. An inverted yield curve is brewing just around the corner, a tell-tell sign of an imminent recession. At some point, every quantitative robot for banks and hedge funds will issue sell signals at the same time, recreating the disaster from eight years ago. It will be “déjà vu” all over again. Liquidity will be nowhere to be found.
Are there other signs in our financial markets that liquidity might be an issue?
High-yield and interest rate sensitive issues took a beating in the markets yesterday, entirely due to Mario Draghi hinting that the ECB might begin tapering “its bond purchases in advance of the scheduled end date next year.” Many analysts have described this event as a wake up call for all investors that have become too enamored with securities in their respective portfolios that are delivering high returns.
The message is that, when the crunch comes, they could easily lose most of their positive returns for this year in a single day. These same analysts warned that this event was not an alarm, but only a suggestion of what might transpire when interest rates begin to rise.
Sooner or later, investors will pay a price for the “cheap money” that has bolstered financial markets across the globe. Has everyone forgotten about the infamous “taper tantrums” of 2013, the time when the Fed suggested that it had to start tapering its bond purchase in the free market? The ECB is definitely a few years behind the Fed, but it is a given that the tapering call to arms is also in their playbook going forward.
The U.S. economy continues to show modest progress toward economic targets, and there are glimmers from recent PMIs in other markets that we may be seeing positive signs that a global resurgence of growth is not too far away. But, Europe is nowhere near their targets. It is too soon to wave the Euro flag, and Brexit is still an issue, as well.
What should investors know about U.S. presidential election market impacts?
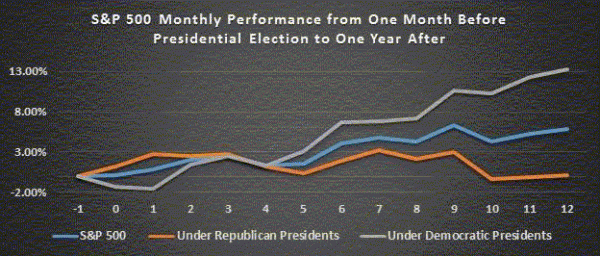
The prevailing press narrative about the upcoming U.S. presidential election is that it will be disruptive, both before, during, and after the process has concluded. Uncertainty will reign, as will the volatility that it generates. The following chart, however, is a type of “fact check” on this general perception of what the reality of the situation truly is:
The chart depicts the results for the S&P 500, both one month before a presidential election and for the full year following the final vote. The outcomes for the past fifty years have also been broken out for each political party, as well. At first glance, the opposing curve traces seem to give credence to the phrase, “If you want to live like a Republican, vote for a Democrat.”
The ascending gray trend line, the one for Democratic presidents, seems to leave its opponents in the dust. Republicans have always countered that more is expected of their regimes than of their Democratic brothers, the reason for the predominant “sell-on-the-news” plot line in orange.
I have written before about what has been called “Presidential Election Cycle Theory”. The consensus of analysts, after reviewing election year data for the past fifty years, is that
the S&P 500 has posted an average return of 6.5% versus 7.9% in all years. Excluding 2008, presidential election years going back to 1960 have seen an average return of 9.1% versus 8.8% for all years.
If we buy into a 9% forecasted gain for 2016, then, compared to results as of September 30th, we still have another 3% or so to go by year end. Are recent articles in the press trying to create a tempest in a teapot?
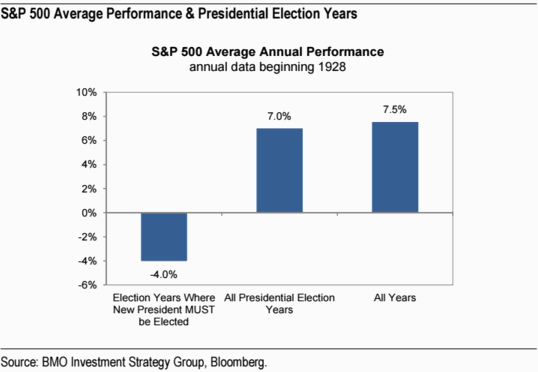
A macro long-term view of data can often give misleading results. It is prudent to dig a little deeper into the data to determine what patterns may actually be the correct ones to support predictions. In this case, there are marked differences that occur when a new president must be elected, as opposed to rallying behind an incumbent. When you make this simple distinction, the data reveals a more troubling perspective:

The potential for a modest 3% gain over the next three months just went out the window, if the above relationship holds true this year. The negative 4% figure above would imply that stocks could plummet 10% before yearend, and that fall is without regard to what the Fed might or might not do.
Concluding Remarks
What are investors to do? Be cautious is “Rule #1”. For the past decade, the VIX has nearly averaged a 23 reading, versus its generally accepted range of 15. Volatility will naturally revisit markets over the next five weeks leading up to Election Day. History has shown that it flattens out a few days before the actual voting takes place, but prepare your forex trading strategies accordingly.
As for those of you with stock or bond portfolios, now is the time to give your positions a thorough review. Uncertainty over the coming weeks related to the election and the potential for a rate hike from the Fed will definitely impact your valuations and ability to close positions quickly and effectively. If you do have high-risk items like sovereign bond issues or stock holdings in developing economies, then you may want to reconsider your short-term strategies going forward. A warning shot has been fired. Take heed or prepare for the consequences.
Risk Statement: Trading Foreign Exchange on margin carries a high level of risk and may not be suitable for all investors. The possibility exists that you could lose more than your initial deposit. The high degree of leverage can work against you as well as for you.