The Dow Jones Transportation Index was the talk of the investment and trading world a few weeks back. Seems everyone, including those that swear technicals do not make any sense, became an expert, embracing Dow Theory and calling for a correction.
Rule #1 of Technical Analysis: Technical Analysis is about identifying points of reflection not points of inflection.
Well that did not turn out so well. But now that the Russell 2000 and NASDAQ 100 are at all-time highs, all is forgotten about Charles Dow and his Theory and we have all moved on to becoming experts on Greece. That is the way of the modern world.
I try not to play those games, but rather, take a broad technical approach to the market as a starting point. Not relying on correlations continuing. But looking at price action on a stand-alone basis and applying multiple types of tools for looking for those reflection points. Now that the Transports have been abandoned, it seems a good time to spend some time looking there.

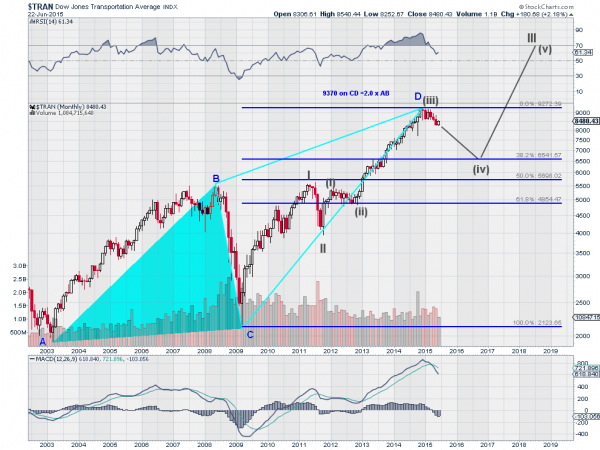
The long-term monthly chart of the Transportation Index, above, has a lot to say. The first thing that jumps out is that the wild and strong pullback has only retraced 14% of the move higher from the 2009 low. If you prefer to measure an absolute pullback then it has made just over 11%. If you needed some perspective this should help. The larger technical picture is not so bright though. There are two big patterns on this chart, an AB=CD pattern, and an Elliott Wave.
Let's look at the AB=CD first. From the 2003 low the AB leg rose to the 2008 high. There was a quick retracement to the financial crisis lows and then the CD leg began. If it completed in December then it made about a 200% extension of the AB leg. From there, a pullback could be expected. And it could get a lot worse than it has been so far. Technicians would brace for 38.2% pullback at least typically, and be pleasantly surprised if it stops well short of that in a show of strength. That is marked at about 6500. Yikes!
The Elliott Wave also starts out scary, but has a silver lining to it. If the Motive Wave started at the financial crisis low then it looks as if the Index is in Wave (iv) of Wave III higher. The scary part is that Wave (iv) would be anticipated to be a downward wave as the other retracement wave, Wave (ii) was flat. And that is what is showing so far. The silver lining is twofold. When Wave (iv) completes the following Wave (v) has a good range higher to complete Wave III.
A technician would look for a repeat of Wave I, or about 1500 points higher. This suggests that Wave (iv) will not fall much further, for Wave (v) to end above Wave (iii). And it gets better. The bigger Wave IV would then anticipate to be flat before Wave V starts a new 5 wave pattern higher of at least 3500 points.
None of this is a guarantee for the future and it is pretty mixed view, so what can you take away from it? First, the transports are falling and the indication is that it will get worse. Second, when they do turn a corner and move higher the move could be a great buying point for both an intermediate term position and a long term investment.
Disclosure: The information in this blog post represents my own opinions and does not contain a recommendation for any particular security or investment. I or my affiliates may hold positions or other interests in securities mentioned in the Blog, please see my Disclaimer page for my full disclaimer.
