With all of the recent market turmoil, we thought we’d take a look at which dividend stocks performed the best this past week. While these aren’t high dividend stocks, we screened for stocks with a dividend yield above 3%, and a moderate dividend payout ratio.
Not surprisingly, these top five dividend stocks are from two well-known defensive sectors – Utilities and Consumer Staples, which are also the two best performing sectors of the past month.
Performance: These stocks have all outperformed the market this week, and over the past trading month, vs. a -1.36% weekly decline and a -2.07% monthly decline for the S&P 500. One of the big reasons for their strong support by the market right now is that they all have low beta’s, which signifies a low correlation to market volatility.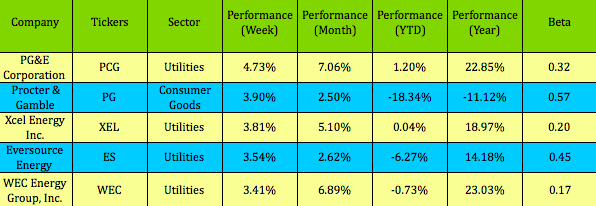
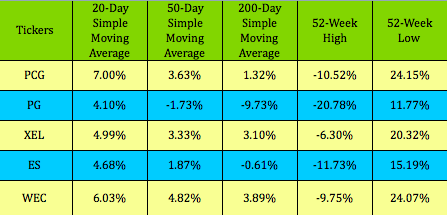
Although the companies, including Pacific Gas & Electric Co (NYSE:PCG) and Eversource Energy (NYSE:ES), have also done well over the past year (excepting Procter & Gamble Company (NYSE:PG)), none of them is at a 52-Week High right now. Xcel Energy Inc (NYSE:XEL) is the closest, being just -6% below its high:
Dividends: It’s a mixed bag for dividend growth rate, with WEC Energy Group Inc (NYSE:WEC) showing the highest growth. WEC’s dividend payout is a little confusing – it paid two monthly pro-rated dividends after its recent buyout of Integrys, but it should revert to a quarterly amount in the $.42 to $.44 range.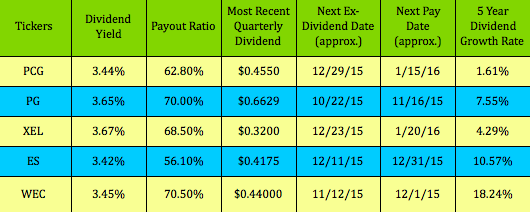
Options: We haven’t added options for any of these stocks to our Covered Calls Table, or to our Cash Secured Puts Table, as their options yields aren’t that attractive.
Earnings: Although it has underperformed the rest of this group in 2015, P&G is trying to get its mojo back, after having had flat sales and negative earnings growth over the past five years. The company has simplified itself, by selling off 100 non-core brands, and has also cut non-manufacturing headcount by 22%, which has resulted in $5.5B in savings. In early Sept., P&G received an upgrade from SunTrust Robinson Humphrey analyst William Chappell, who cited valuation that was “too compelling to ignore.”.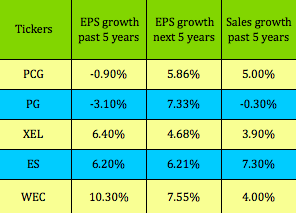
Valuations: We were pleased to see falling Forward P/E’s, which implies better forward earnings for all of these companies.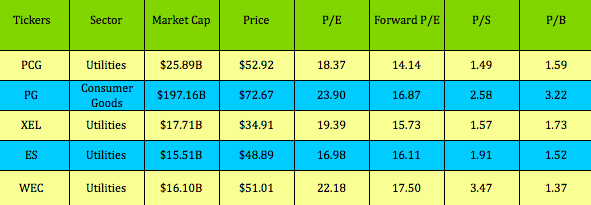
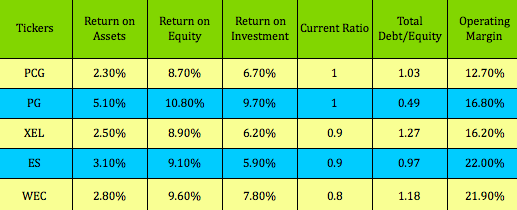
Financials: Among the four Utilities stocks, WEC appears to have an edge in its Management Efficiency ratios, and also has one of the higher Operating Margins. P&G’s management ratios are all above its industry’s averages, particularly its ROE, which is 10.80% vs. the industry avg. of 7.47%.
Disclosure: Author owned shares of PG at time of writing this article.
Disclaimer: This article isn’t intended as investment advice. Please do your own due diligence.

