
The Shanghai index broke below 20-year support line (1) in the chart below, attempted to climb back above this new resistance line and looks to have failed at (2). Now the Shanghai index is breaking down further and Copper is breaking a three year support line at the same time.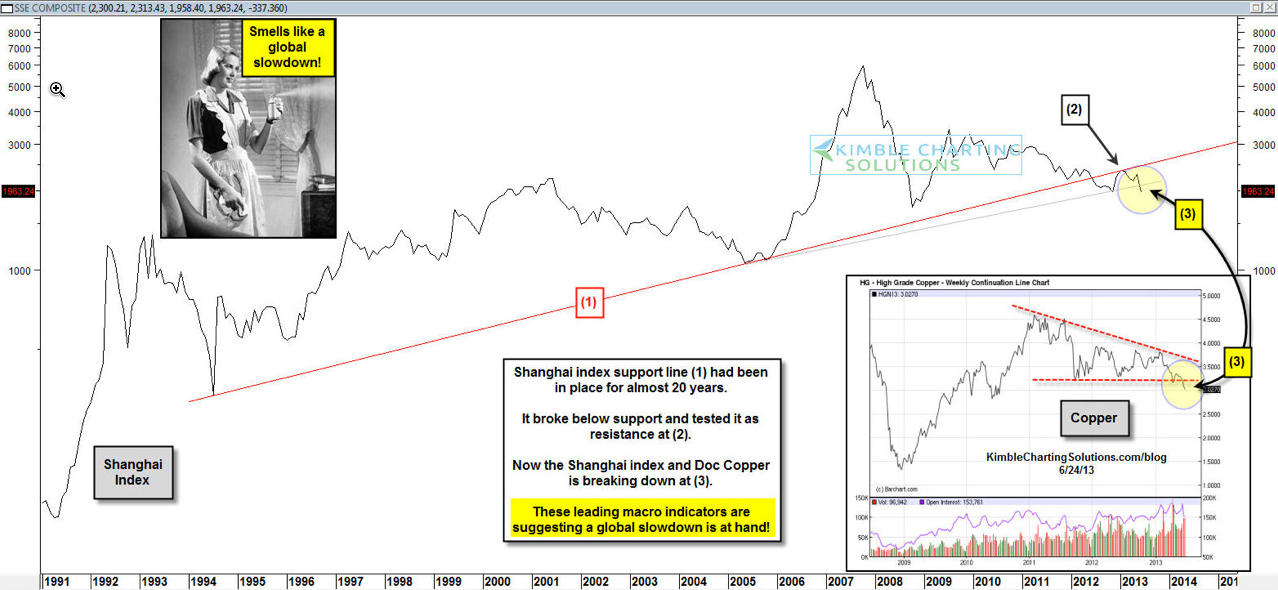
These leading indicators breaking support at the same time are suggesting a global slowdown is near. Do these breakdowns reflect that a 'Perfect Portfolio Storm' is about to happen or already has?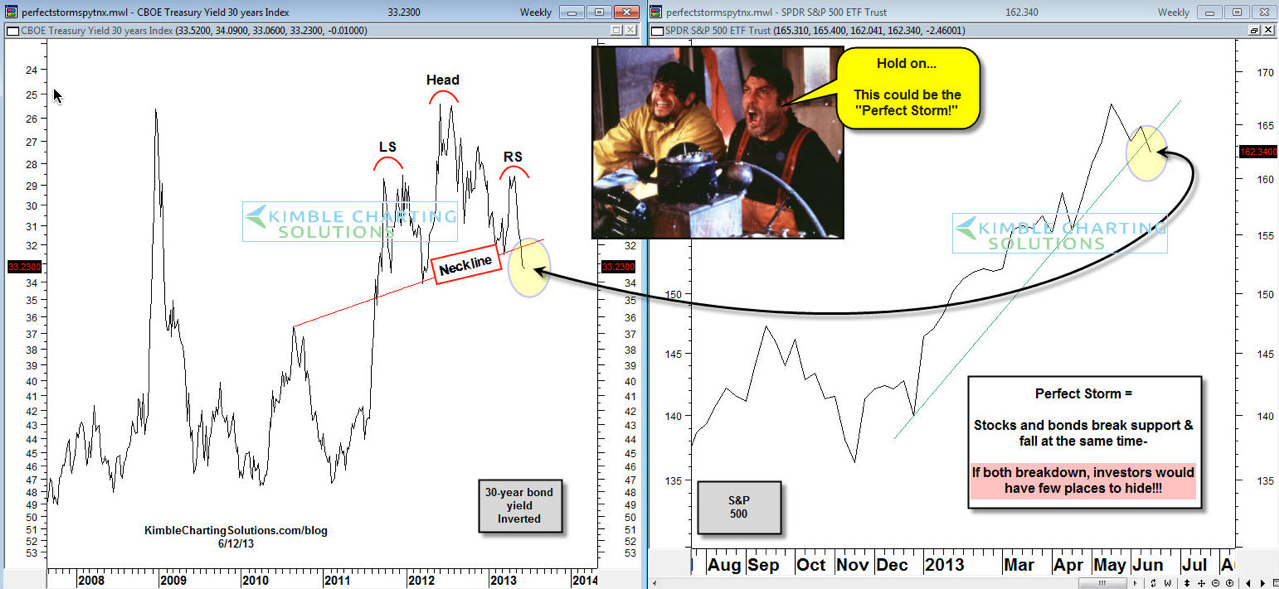
The above chart reflects that Government bonds and stocks are working on breakdowns at the same time, a further suggestion something is going on that investors haven't seen many times in the past 13 years.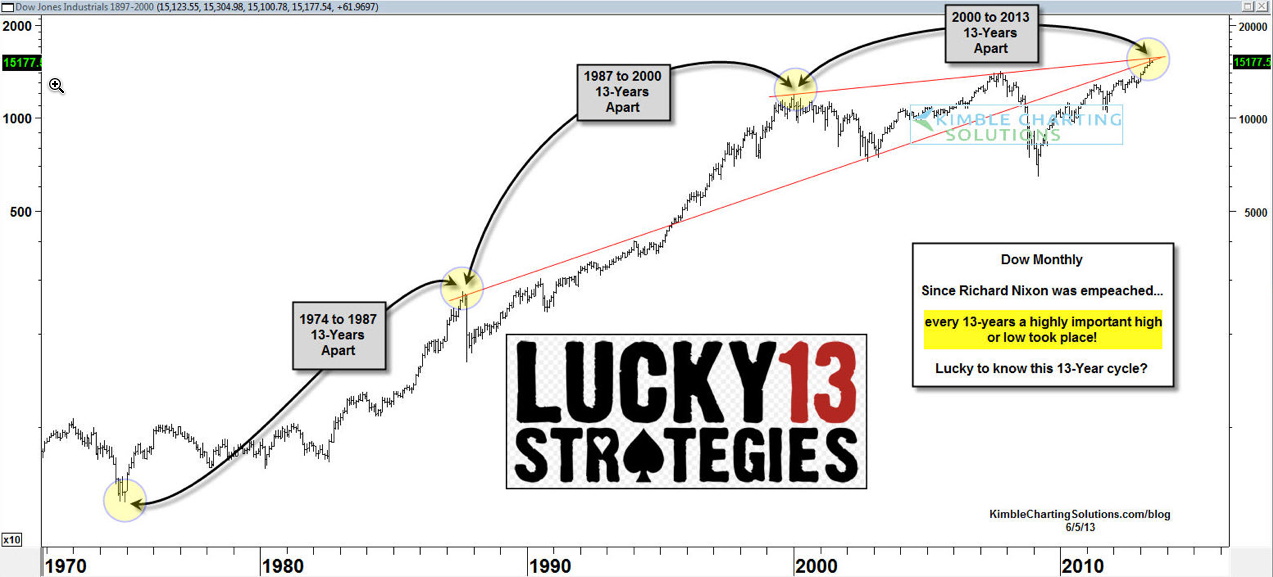
Speaking of 13-years, since the mid 1970s, every 13 years a historic high or low has taken place in the Dow, reflected in the chart above. Will we have another repeat this year?
Members have been positioned to take advantage of weakness by shorting emerging markets and Japan for a few weeks and certain patterns in the banks suggest relative weakness could take place in this sector.
- English (UK)
- English (India)
- English (Canada)
- English (Australia)
- English (South Africa)
- English (Philippines)
- English (Nigeria)
- Deutsch
- Español (España)
- Español (México)
- Français
- Italiano
- Nederlands
- Português (Portugal)
- Polski
- Português (Brasil)
- Русский
- Türkçe
- العربية
- Ελληνικά
- Svenska
- Suomi
- עברית
- 日本語
- 한국어
- 简体中文
- 繁體中文
- Bahasa Indonesia
- Bahasa Melayu
- ไทย
- Tiếng Việt
- हिंदी
These Indicators Point To Global Slowdown
Published 06/24/2013, 01:53 PM
Updated 07/09/2023, 06:31 AM
These Indicators Point To Global Slowdown
Latest comments
Install Our App
Risk Disclosure: Trading in financial instruments and/or cryptocurrencies involves high risks including the risk of losing some, or all, of your investment amount, and may not be suitable for all investors. Prices of cryptocurrencies are extremely volatile and may be affected by external factors such as financial, regulatory or political events. Trading on margin increases the financial risks.
Before deciding to trade in financial instrument or cryptocurrencies you should be fully informed of the risks and costs associated with trading the financial markets, carefully consider your investment objectives, level of experience, and risk appetite, and seek professional advice where needed.
Fusion Media would like to remind you that the data contained in this website is not necessarily real-time nor accurate. The data and prices on the website are not necessarily provided by any market or exchange, but may be provided by market makers, and so prices may not be accurate and may differ from the actual price at any given market, meaning prices are indicative and not appropriate for trading purposes. Fusion Media and any provider of the data contained in this website will not accept liability for any loss or damage as a result of your trading, or your reliance on the information contained within this website.
It is prohibited to use, store, reproduce, display, modify, transmit or distribute the data contained in this website without the explicit prior written permission of Fusion Media and/or the data provider. All intellectual property rights are reserved by the providers and/or the exchange providing the data contained in this website.
Fusion Media may be compensated by the advertisers that appear on the website, based on your interaction with the advertisements or advertisers.
© 2007-2024 - Fusion Media Limited. All Rights Reserved.