One of the big stories in the foreign-exchange market this year has been the strength of the Japanese yen. It's up 17.3% so far this year, despite negative interest rates over 10 years and a stock market that's off 13.4%.
We suggest that the answer to the conundrum posed by the yen's strength lies with the Japanese themselves. The yen's weakness associated with the launch of Abenomics coincided with the diversification of Japanese pension-fund managers offshore. The recovery of the yen has coincided with the hedging of these flows and the raising of hedge ratios by insurance companies and corporations. 
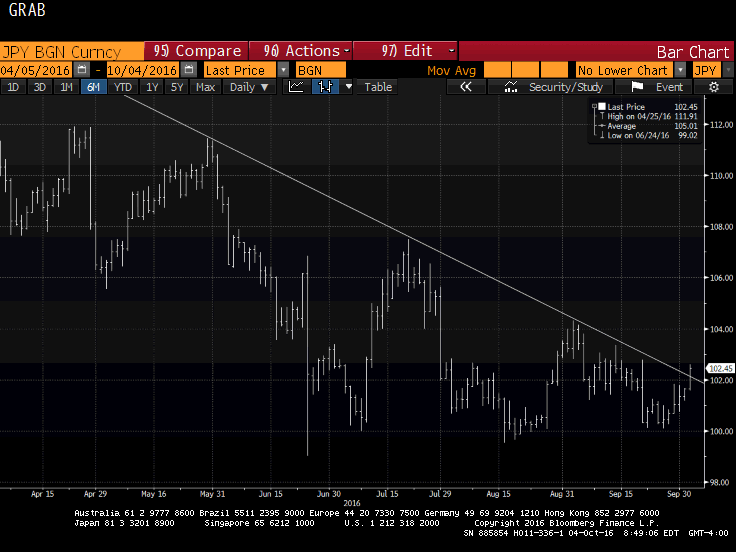
This first graphic shows that the modest dollar gains during this six-day advancing streak have been sufficient to lift the greenback through a nearly five-month-old downtrend. The dollar is poised to close above its 50-day moving average against the yen for the first time in almost a month. We see immediate resistance near JPY102.80, which corresponds to the high from the second half of September and a retracement target of the drop from the early September high near JPY104.30.
This next chart also shows that the dollar's downside momentum has eased since the end of Q2 16. Since then, the dollar has moved broadly sideways in its trough. In late September, it again tested the JPY100 level -- and it held. The August low was set near JPY99.50 and the UK referendum-spike low was nearer JPY99.00. 
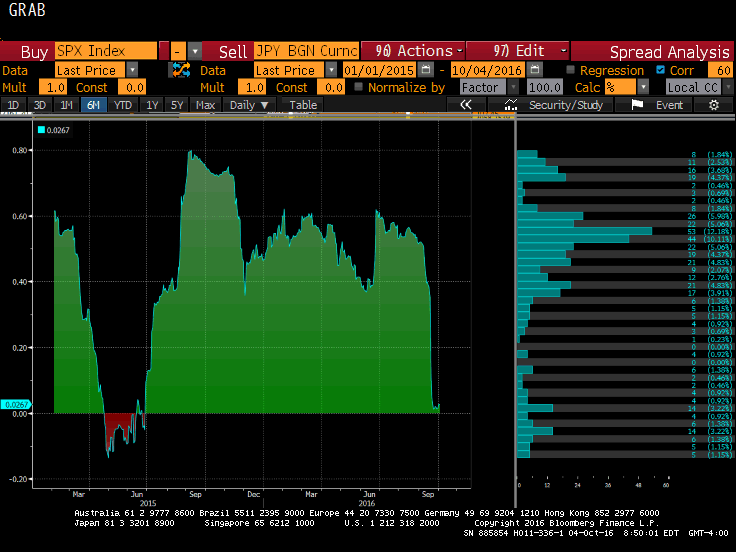
What is driving the dollar-yen exchange rate appears to be changing. The following chart shows the correlation between the percentage change in the dollar-yen and the percentage change in the S&P 500. On this chart, we plot the rolling 60-day correlation since the start of 2015.
In Q2 15, the correlation was negative, but after that period ended, the correlation reached 0.90 in Q3 2015. It fluctuated, but as recently as the beginning of Q3, it was near 0.60. It has fallen to near zero now. The weakening of the correlation between the yen and the S&P 500 suggests that the yen's so-called safe-haven status has weakened. 
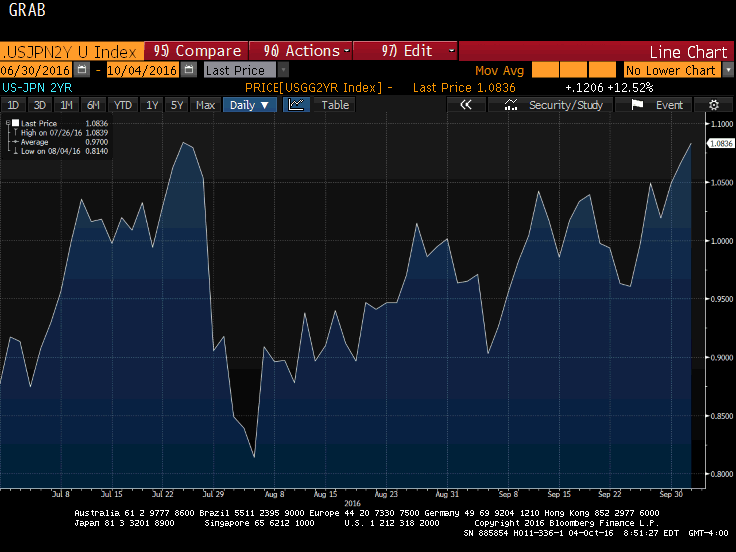
The third chart suggests another potential driver of the dollar-yen exchange rate. This chart depicts the two-year interest-rate differential between the US and Japan over the last several months. The US 2-year yield is up 21 bp over the past three months to stand a little above 80 bp. Over the same period, Japan's 2-year yield has risen 4.5 bp. The spread is near 109 bp today, which matches the late-July high.
Usually, the long-end differentials are more important for the dollar-yen rate. The spread has been flattish for two months. It last poked through 200 bp in April,and since then, has been trending lower. It reached a low in early September near 155 bp. It is currently a little above 170 bp. On September 20 it was at 175 bp.
