Get 40% Off
⚠ Earnings Alert! Which stocks are poised to surge?
See the stocks on our ProPicks radar. These strategies gained 19.7% year-to-date.
Unlock full list

The Whole ‘Sell-In-May’ Cliche And Yields

Published 05/06/2014, 03:23 PM
Updated 07/09/2023, 06:31 AM

Tis the season to hear,"Sell in May and Go away," a mantra that comes from below-average stock performance during the May-to-October time frame, compared to stronger stock performance between October and May.

What About Yields?

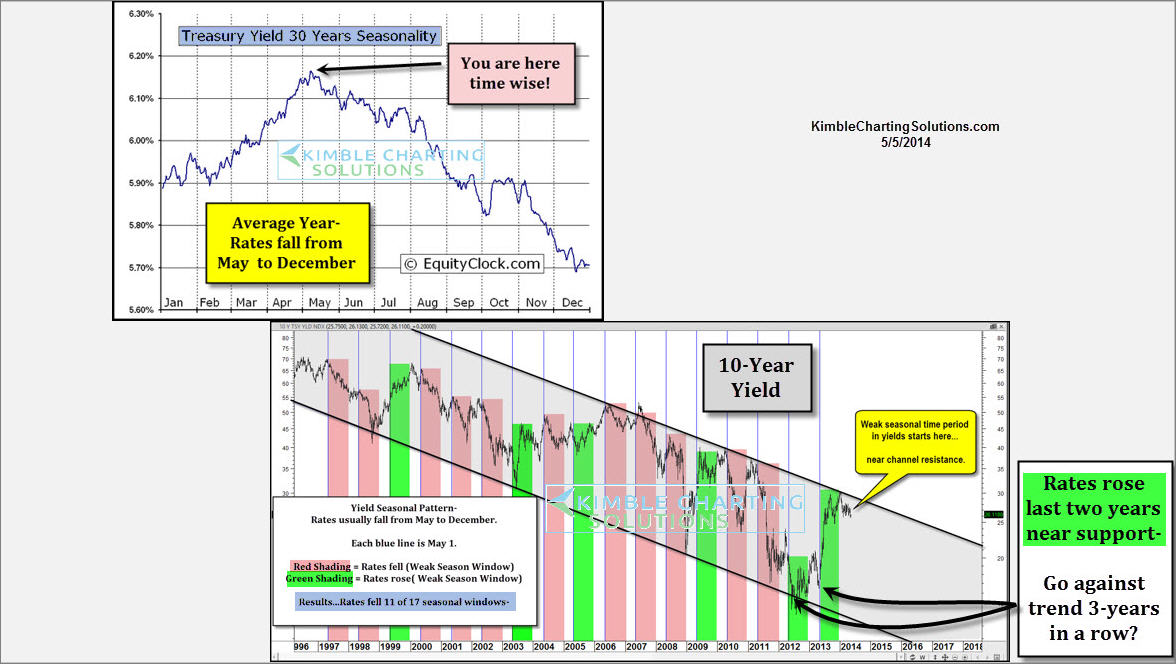
Can we apply that idea to Yields? Is it possible to "Sell Yields in May and Go away?" The upper left chart below shows the "seasonal pattern that the 30-year bond" seems to follow, reflecting that yields tend to peak in May and decline through December. The seasonal bond chart was created by Equityclock.com.

The lower right chart below looks at each year's May to December performance of the yield on the 10-year note over the past 17 years. This chart reflects that yields have declined 11 of the past 17 years (Two-thirds of the time). The red shaded areas reflect falling yields in the May-Dec time frame and the Green shaded areas reflect rising yields in the May-Dec time frame.

10-Year Yields

The last two years yields have bucked the trend, rising during this time frame. Will it be different this year?

Norm Or Aberration?

The 18-Month Question

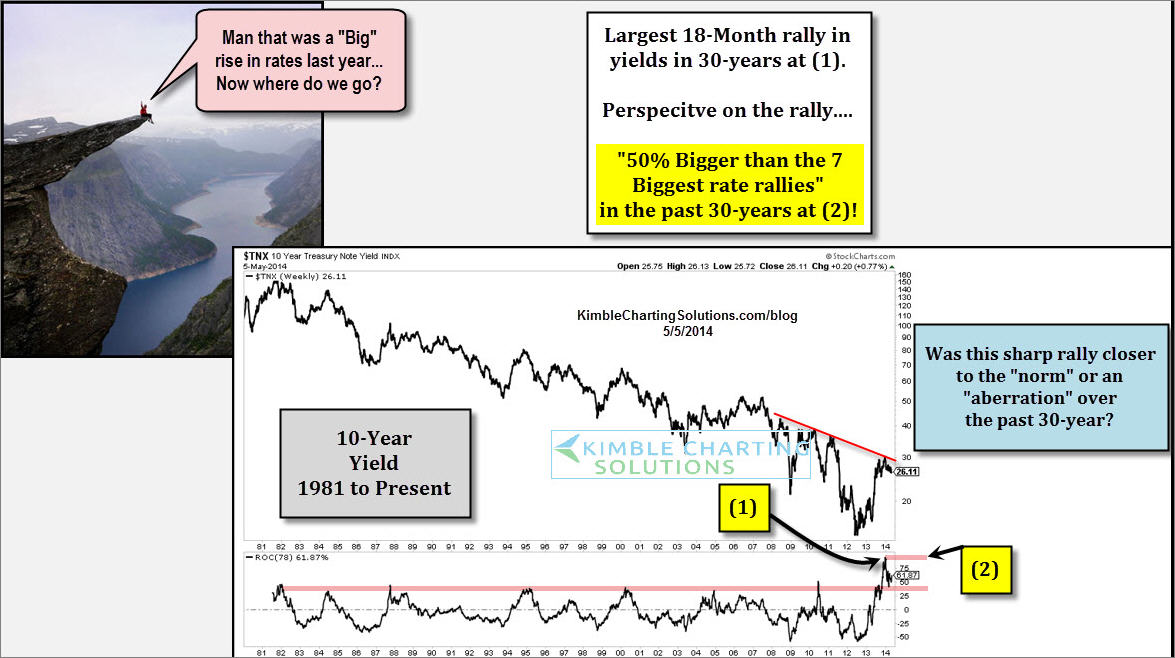
Was the rally over the past 18-months in yields, the norm or closer to an aberration? Think about it. If you took the 7 largest 18-month-rate rallies over the past 30-years, the rate increase we just endured was over 50% bigger than every one of them. My take? It was much closer to an aberration than the norm.

The Power of the Pattern has been beating the drum to Premium Members since December of 2013, suggesting that rates were due to decline/bonds to rally. Few bond traders were bullish the beginning of 2014, and most of the chatter has been about the Taper and rising rates!

Tell me again about rising interest rates. (See post here.)

Latest comments

10 yr to go back to the 1.6% area due to coming deflationary wave. Janet Yellen and screamin about it from now, she be deflation queen.
Risk Disclosure: Trading in financial instruments and/or cryptocurrencies involves high risks including the risk of losing some, or all, of your investment amount, and may not be suitable for all investors. Prices of cryptocurrencies are extremely volatile and may be affected by external factors such as financial, regulatory or political events. Trading on margin increases the financial risks.
Before deciding to trade in financial instrument or cryptocurrencies you should be fully informed of the risks and costs associated with trading the financial markets, carefully consider your investment objectives, level of experience, and risk appetite, and seek professional advice where needed.
Fusion Media would like to remind you that the data contained in this website is not necessarily real-time nor accurate. The data and prices on the website are not necessarily provided by any market or exchange, but may be provided by market makers, and so prices may not be accurate and may differ from the actual price at any given market, meaning prices are indicative and not appropriate for trading purposes. Fusion Media and any provider of the data contained in this website will not accept liability for any loss or damage as a result of your trading, or your reliance on the information contained within this website.
It is prohibited to use, store, reproduce, display, modify, transmit or distribute the data contained in this website without the explicit prior written permission of Fusion Media and/or the data provider. All intellectual property rights are reserved by the providers and/or the exchange providing the data contained in this website.
Fusion Media may be compensated by the advertisers that appear on the website, based on your interaction with the advertisements or advertisers.
© 2007-2024 - Fusion Media Limited. All Rights Reserved.