Get 40% Off
⚠ Earnings Alert! Which stocks are poised to surge?
See the stocks on our ProPicks radar. These strategies gained 19.7% year-to-date.
Unlock full list

Oil's Muddy Water Is Even Less Clear Now

Published 11/24/2015, 12:58 AM

Monday was an odd combination of boring and annoying, but I managed to eke out a small profit by day’s end. The centerpiece of the lunacy early on was crude oil, which I was excitedly watching crumble last night. In the early morning hours, I glanced at my iPad, and I had a total WTF moment when I saw crude was rocketing higher based on the fact that Saudi Arabia, which apparently has joined the rest of the world in believing descending markets should be forbidden, stated they would do everything in their power to reverse oil’s price slide (see arrow mark). Most of that gain unraveled not long after, but then crude gyrated aimlessly the entire day. Oil’s muddy water is even less clear now.
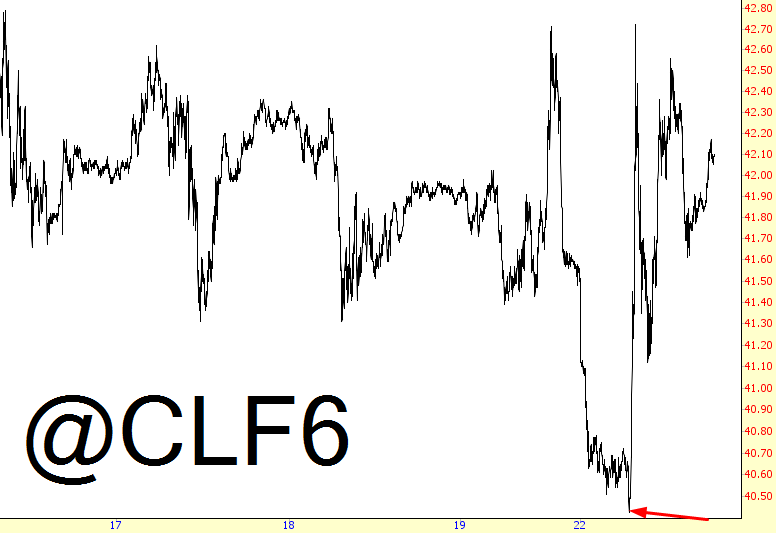
Crude Oil Chart

Equities continue to be held aloft by leprechauns, faerie dust, and wishful thinking. It seems August 21 and 24 represent the only crack where sanity was permitted to enter. The equity markets, to me, are sort of like having O.J. Simpson stand up for his verdict every day and be found Not Guilty. Every sensible person knows he’s guilty (and that the market is wildly overvalued), but, miracle of miracles, he’s let free (and the market stays aloft).

Thus, we have the Dow Jones Composite that, for the third time, is just kind of hanging out at the upper reaches where, so far, it has simply limped lower.
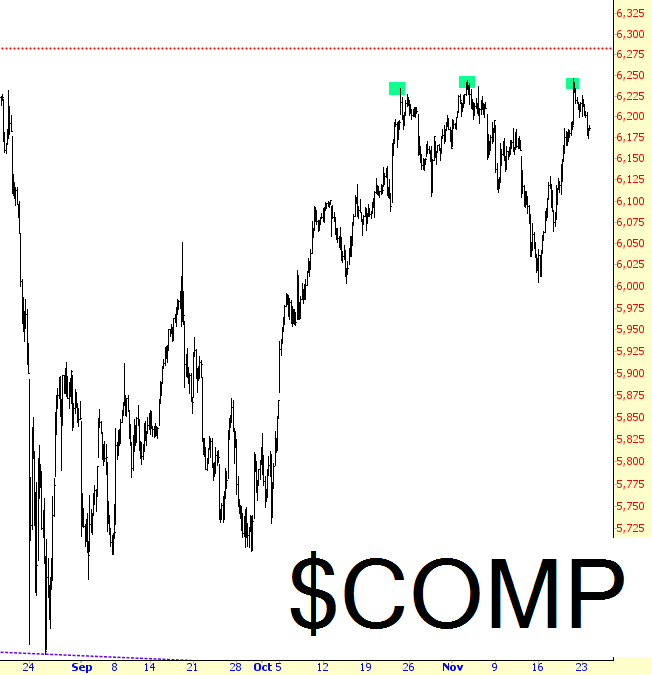
Dow Jones Composite Chart

The risk to the bears, I think, is best illustrated by the Russell 2000 (which, as an index, was stronger today than, say, the NASDAQ). The potential inverted head and shoulders is shown below, and a break above 1200 would pretty much put a knife through the heart of the bear (for the 527nd time) for the foreseeable future. I don’t take the year-end strength lightly, because that’s been the norm.
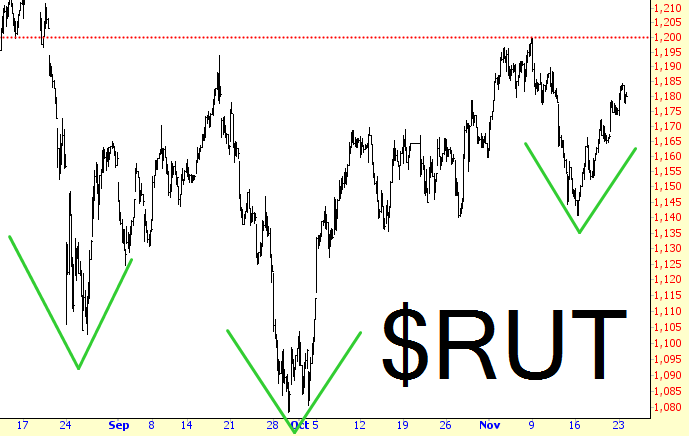
RUT Chart

If there’s one sector I remained focused on with my positions, it’s still oil/commodities, nicely expressed with the oil and gas sector index shown below. Just like 1200 is a key level for the Russell 2000 shown above, so too that number is important (although not as important) to the XOI. There’s no other sector better-poised for meaningful downside that this one.
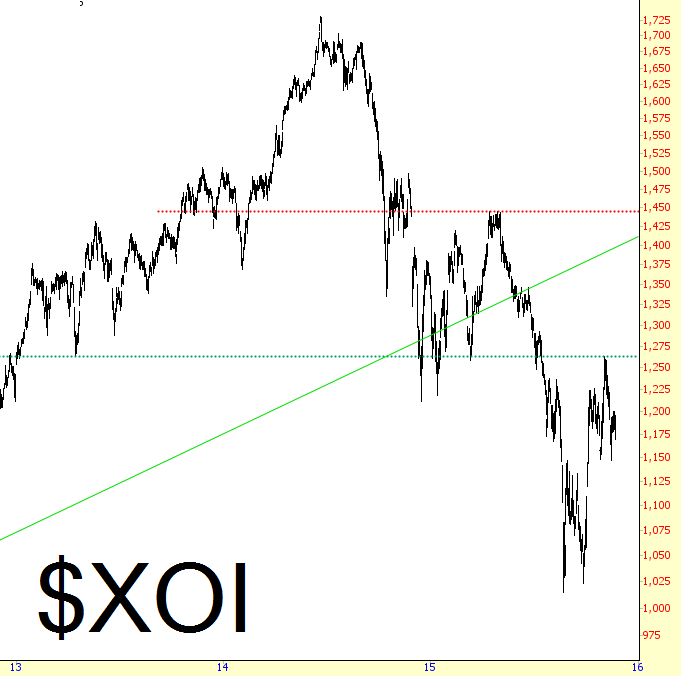
XOI Chart

I can only hope that, as with O.J., if justice isn’t served for the first crime, then stocks will just get tripped up later by something stupid like trying to rob a memorabilia dealer in Las Vegas at gunpoint. Just sayin’.

Latest comments

Crude's current trajectory will heavily depend on Saudi Arabia and the upcoming OPEC meeting. If OPEC can string together some agreements, this could stabilize the sliding oil prices for a period of time. It is not clear if this is possible considering the disagreements within OPEC. Some OPEC members have outright claimed that Saudi Arabia is using OPEC to their own end and forcing everyone else to go along with it.
Risk Disclosure: Trading in financial instruments and/or cryptocurrencies involves high risks including the risk of losing some, or all, of your investment amount, and may not be suitable for all investors. Prices of cryptocurrencies are extremely volatile and may be affected by external factors such as financial, regulatory or political events. Trading on margin increases the financial risks.
Before deciding to trade in financial instrument or cryptocurrencies you should be fully informed of the risks and costs associated with trading the financial markets, carefully consider your investment objectives, level of experience, and risk appetite, and seek professional advice where needed.
Fusion Media would like to remind you that the data contained in this website is not necessarily real-time nor accurate. The data and prices on the website are not necessarily provided by any market or exchange, but may be provided by market makers, and so prices may not be accurate and may differ from the actual price at any given market, meaning prices are indicative and not appropriate for trading purposes. Fusion Media and any provider of the data contained in this website will not accept liability for any loss or damage as a result of your trading, or your reliance on the information contained within this website.
It is prohibited to use, store, reproduce, display, modify, transmit or distribute the data contained in this website without the explicit prior written permission of Fusion Media and/or the data provider. All intellectual property rights are reserved by the providers and/or the exchange providing the data contained in this website.
Fusion Media may be compensated by the advertisers that appear on the website, based on your interaction with the advertisements or advertisers.
© 2007-2024 - Fusion Media Limited. All Rights Reserved.