Do you have an opinion about stocks or bonds or foreign exchange? If so, it is easy to find a market message that will support (or contradict) your viewpoint.
The "message" of the market has rarely been this confused. With plenty of important news and data this week, the theme will be: Can we find clarity in the market message?Last week I expected a focus on housing. The short trading week would start with Prof. Shiller (that was right) and end with discussion of pending home sales (also right). In between, there was plenty of filler because nothing much seemed to be happening. I lost count of the number of stories about the driverless Google car – interesting, but not very relevant for the markets.
Forecasting the theme is an exercise in planning and being prepared. Readers are invited to play along with the "theme forecast." I spend a lot of time on it each week. It helps to prepare your game plan for the week ahead, and it is not as easy as you might think. Feel free to suggest your own likely theme in the comments.
Naturally we would all like to know the direction of the market in advance. Good luck with that! Second best is planning what to look for and how to react.
This Week's Theme
What is the "message" of the market? Will it be clarified this week?
Here are three perspectives, from three different markets:
- Stocks are at new highs. Historically, stocks have been a leading indicator for the economy, reflecting expectations about future earnings.
- Bonds are rallying. Many view this as a sign of economic weakness. Those who are bearish on the economy like to insist that the bond market is "smarter" than that for stocks. Santelli watchers get this viewpoint every day. Cullen Roche offers some alternative concepts. I analyzed several explanations two weeks ago in this WTWA post.
- The VIX (the volatility index) is making fresh lows. Most pundits argue that this demonstrates unwarranted complacency. It is a warning to equity investors. (See a good argument at Free exchange. See also Cam Hui for a more nuanced interpretation).
The market message is confused and inconsistent!
As usual, I have some thoughts that I will share in the conclusion. First, let us do our regular update of the last week's news and data. Readers, especially those new to this series, will benefit from reading the background information.
Last Week's Data
Each week I break down events into good and bad. Often there is "ugly" and on rare occasion something really good. My working definition of "good" has two components:
- The news is market-friendly. Our personal policy preferences are not relevant for this test. And especially – no politics.
- It is better than expectations.
The Good
There was plenty of encouraging news.
- Consumer confidence improved. This is the Conference Board version. It usually tracks with Michigan, but not always. Doug Short has good analysis and charts.
- Chicago PMI was very strong at 65.5. This is the best read on the national ISM manufacturing report. It gets more attention when there is a weekend before the national report. It is good news, but we'll know a lot more on Monday.
- Case-Shiller home prices beat expectations rising 1.2%.
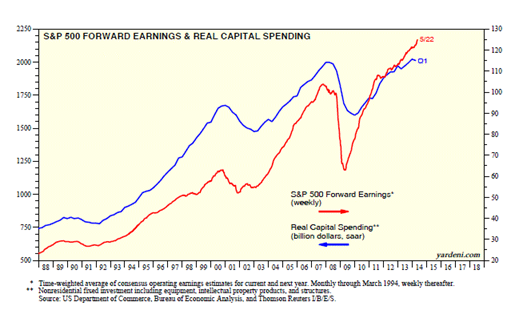
- Capital spending should improve. Even bearish economists note the importance of capital spending. Dr. Ed Yardeni explains the relationship with forward earnings, which continue to improve.
- Initial jobless claims improved dramatically. This is a noisy series, but one of the best concurrent economic indicators. It helps us to understand the number of job losses, but we still need to learn about new job creation.
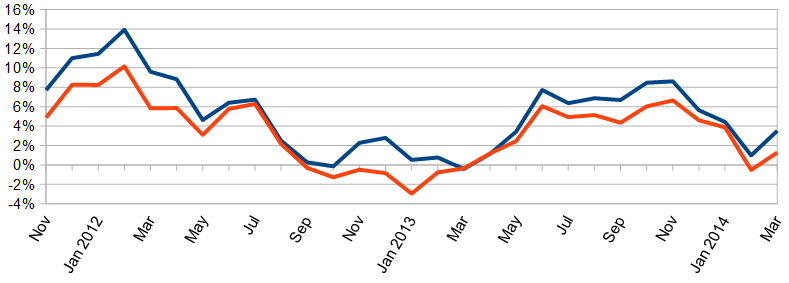
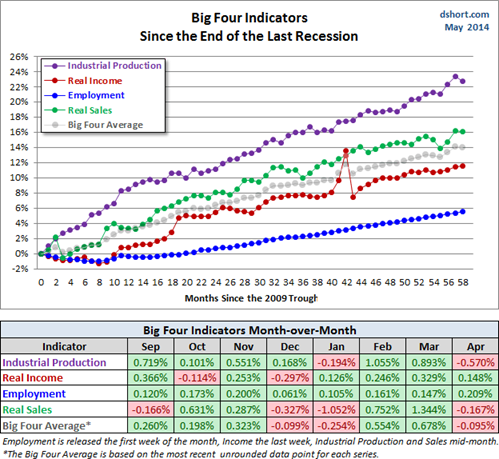
- Durable goods orders were strong, up 0.8% seasonally adjusted and even stronger on non-adjusted data. Steven Hansen at GEI has complete analysis and charts, including this one:
The Bad
There was a fair share of bad news last week.
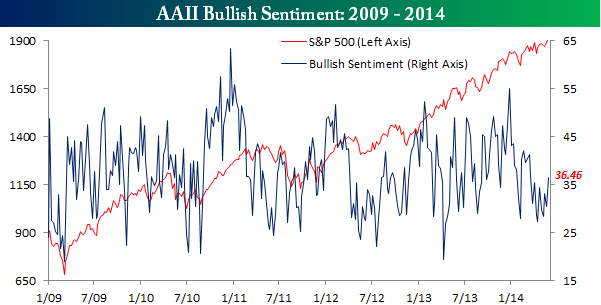
- Sentiment is more bullish. This is a contrarian indicator. Bespoke tracks the American Association of Individual Investors series. Their typically fine chart shows the current gain, the biggest jump in more than a month. They also note that it is not yet at the average for the entire bull market – 38.4%
- Personal spending declined by 0.1% in April. Personal income growth was acceptable at 0.3% (Calculated Risk).
- Michigan sentiment disappointed with a final May reading of 81.9. I view this series as important (and not just because I am a Michigan man). My own research shows it to be a good indicator of spending and employment. Doug Short does a regular update of the series which includes my favorite chart. You can find it here.
- Pending home sales disappointed, with growth of only 0.4%. Sober Look argues that lower mortgage rates will not help. Bonddad remains bearish.
-
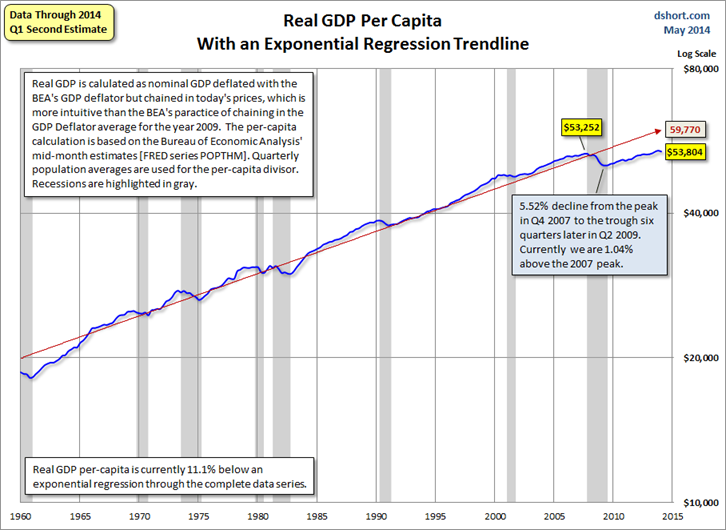
GDP declined 1% in the first quarter of 2014. I am scoring this as "bad news" since it was a significant downward revision and GDP is the final measure of economic performance. In fact, the market shrugged off the news. Dan Gross notes the inventory effect (accounting for the entire revision). Personal consumption increased 3.3% and durable goods increased 1.4% despite weather effects. (Hale Stewart). Prof. James Hamilton provides an even-handed take. He notes the weather and the consumption increase, but also observes that part of the spending increase was on health care. Business fixed investment and new home construction declined. "I am still expecting numbers for the rest of the year to come in much better. But there's no getting around the fact that 2014 got off to a pretty weak start."
One way of viewing the data is in terms of real GDP per capita. This method is recommended by my Scutify jousting colleague Simon Constable in his award-winning book on economic indicators – an excellent reference. (Curiously, I act more like a consumer of data while Simon claims an advantage over the economists he covers as a journalist. Maybe we should switch jobs!) Doug Short does a regular update of GDP in these terms. His fine chart (one of many good ones) shows the sad story of continuing disappointment in the US economy. (Doug's charts should be classroom examples for those trying to explain data – log scale when appropriate, helpful trend lines, accurate sourcing, good description, multiple variables all clearly included, and helpful callouts.)
-
The Ugly
Detroit rebuilding costs. Knocking down abandoned property is an inevitable part of fighting blight in a city that has gone from a population of 1,850,000 in 1950 to 700,000 last year. The abandoned homes will never be used again. Even destroying those leaves problems of lead and asbestos abatement. The cost estimate is $850 million. Fewer than half of property owners pay taxes. 118,000 properties are on track for tax foreclosure, but who will buy them?
There are no easy solutions.
The Silver Bullet
I occasionally give the Silver Bullet award to someone who takes up an unpopular or thankless cause, doing the real work to demonstrate the facts. Think of The Lone Ranger.
This week's award goes to Paul Kasriel (via GEI), who shows the error in knee-jerk analyses of the unemployment rate. He writes that everyone has been trained to do a quick comparison of labor force participation with unemployment to see if the rate is providing a clear message. This is not enough. He writes as follows:
… (A) decline in the labor force does not always reflect an increase in so-called discouraged workers. And, in fact – well, fact may be too strong a word, but according to data contained in the April Household Employment Survey – the number of people not in the labor force in April but who did want a job changed by a big fat ZERO.
This is something to watch for this coming Friday.
Quant Corner
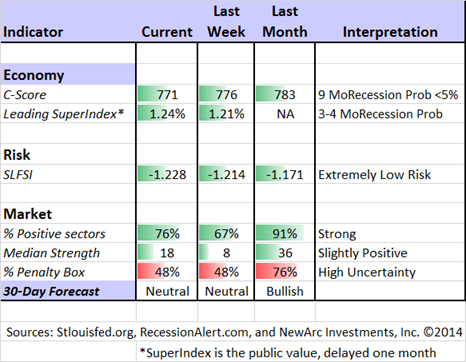
Whether a trader or an investor, you need to understand risk. I monitor many quantitative reports and highlight the best methods in this weekly update. For more information on each source, check here.
Recent Expert Commentary on Recession Odds and Market Trends
Georg Vrba: Updates his unemployment rate recession indicator, confirming that there is no recession signal. Georg's BCI index also shows no recession in sight. For those interested in hedging their large-cap exposure, Georg has unveiled a new system.
RecessionAlert: A variety of strong quantitative indicators for both economic and market analysis.
Bob Dieli does a monthly update (subscription required) after the employment report and also a monthly overview analysis. He follows many concurrent indicators to supplement our featured "C Score." One of his conclusions is whether a month is "recession eligible." His analysis shows that none of the next nine months could qualify. I respect this because Bob (whose career has been with banks and private clients) has been far more accurate than the high-profile TV pundits.
Doug Short: An update of the regular ECRI analysis with a good history, commentary, detailed analysis and charts. If you are still listening to the ECRI (2 ½ years after their recession call), you should be reading this carefully. Doug also has the best continuing update of the most important factors to the NBER when they analyze recessions. In general, you need to have a business cycle peak and then a significant decline. In contrast with Bob Dieli's method, this approach shows a possible peak in some of the elements.
The Week Ahead
We have plenty of data this week including the most important reports. The WSJ focus on the big news is helpful – a useful alternative to the comprehensive list.
The "A List" includes the following:
- Employment report (F). Rightly or wrongly, this remains the most important data for the market.
- ISM index (M). A sensitive gauge of manufacturing trends with some leading components.
- ECB policy decision (Th). Important not only for forex, but for stocks and bonds as well. Here is a guide about what to watch. And also here.
- Initial jobless claims (Th). Best concurrent read on employment.
The "B List" includes the following:
- ISM services (W). More businesses covered than manufacturing, but a shorter history for the series.
- ADP employment (W). This measure of private employment deserves respect, and gets it from most Street economists.
- Auto sales (T). Good read on possible consumer rebound. Watch the F150 indicator of construction activity.
- Beige book. (W). This is the "color" provided to FOMC participants at the next meeting – anecdotal evidence from each Fed district. Will it confirm the official interpretation of data?
- Construction spending (M). April data, but an important sector.
- Factory orders (T). More April data.
- Trade balance (T). April data, but relevant for Q2 GDP, which will be a subject of great interest.
There will be plenty of FedSpeak and also news from the G-7 Summit in Brussels.
How to Use the Weekly Data Updates
In the WTWA series I try to share what I am thinking as I prepare for the coming week. I write each post as if I were speaking directly to one of my clients. Each client is different, so I have five different programs ranging from very conservative bond ladders to very aggressive trading programs. It is not a "one size fits all" approach.
To get the maximum benefit from my updates you need to have a self-assessment of your objectives. Are you most interested in preserving wealth? Or like most of us, do you still need to create wealth? How much risk is right for your temperament and circumstances?
My weekly insights often suggest a different course of action depending upon your objectives and time frames. They also accurately describe what I am doing in the programs I manage.
Insight for Traders
Felix is a bit more upbeat this week. There are more fresh buys in the ETF universe, including PowerShares QQQ (NASDAQ:QQQ). The high penalty box level implies less than normal confidence in the ratings. We briefly cut our trading position size during the week, but finished the week fully invested in three top ETF sectors.
The overall call is very close between bullish and neutral. Even in a neutral market there are often good sectors to buy.
Insight for Investors
I review the themes here each week and refresh when needed. For investors, as we would expect, the key ideas may stay on the list longer than the updates for traders. The current "actionable investment advice" is summarized here.
The market did not provide much opportunity for fresh buys. The gentle upward action is fine for long-term investors and excellent for those trying out our Enhanced Yield approach.
Here are some key themes and the best investment posts we saw last week:
Doom and gloom sells – like sex, writes Howard Gold at MarketWatch. He is keeping score at taking names! This is so much better than the TV folks who pander to viewers by trotting out these pundits without any reference to past record. He writes:
It draws viewers to TV, eyeballs to websites and buyers to books from "Crisis Investing," published in 1980, to "Surviving the Great Depression of 1990" to "The Collapse of the Dollar and How to Profit from It" (2008).
The financial crisis and Great Recession created a bull market in doom and gloom. But nearly six years after Lehman Brothers' collapse, the worst hasn't happened — unless you consider a 180% advance in the S&P 500 Index a disaster. Which it was, to those who avoided U.S. stocks because they believed the doom-and-gloomers.
So, now, enough time has passed to label certain outrageous forecasts as just plain wrong and to call out the people who made them.
Here are the four worst predictions to gain traction over the past few years.
Regular readers might want to guess before reading!
Could there be a "stealth recovery" in the economy? The analysis from HighTower Advisors includes this interesting quotation from Richard Bernstein:
Bear markets are made of tight liquidity, significantly deteriorating fundamentals, and investor euphoria. Although the Fed is starting to reverse course, there are no signs yet of a significant tightening of liquidity. Rather, the data are beginning to suggest that private sector credit growth is starting to replace the Fed as the provider of liquidity
Sell in May did not work. (WSJ). Serial correction forecasters will insist that it is now "Sell in June" or something else. The reality, an answer to my client questions nearly every week:
- There will be a market correction of 15-20%. Look at a long-term chart. It is a regular event.
- You cannot predict when these will occur and neither can the supposed experts. If you get good evidence on their market timing records, you will see. Check out my post on the Seduction of Market Timing.
- Those trying to time this correction have already missed a big move. Ironically, this does not convince them of a mistake. Instead, they are even more determined to wait.
- A better approach is to watch the fundamental indicators (recession odds and financial stress) and quit trying to time the smaller swings.
You pay too much attention to financial news. Morgan Housel describes this so well! Here is the daily story:
NEW YORK – S&P 500 companies earned $2.71 billion of net income on Tuesday. $890 million of that will be paid out as dividends, with the remainder retained for future growth.
That's it. The report would be the same tomorrow, the next day, and the next. Figures would be updated quarterly, but the format wouldn't change, ever.
This would not be very good for ratings, but it would help your bottom line.
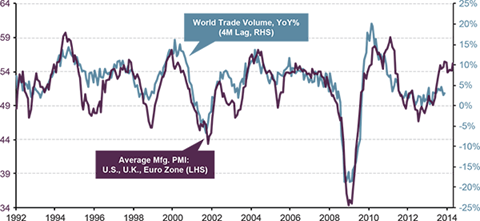
Take advantage of pessimism writes Scott Minerd of Guggenheim partners. After noting the recurring prophesies of doom, he suggests that central banks remain active on the other side. He writes as follows, providing a helpful chart as well:
U.S. and European economic data have been on an improving trend, helping to bolster the outlook for the global economy. As output accelerates in advanced economies, countries around the world should benefit from increasing demand for manufacturing inputs. With the investment cycle turning in the United States and Europe, global trade should accelerate in the near term, helping kick-start growth in some struggling emerging market economies.
If you are obsessed about possible market declines, you have plenty of company. This is one of the problems where we can help. It is possible to get reasonable returns while controlling risk. Check out our recent recommendations in our new investor resource page -- a starting point for the long-term investor. (Comments and suggestions welcome. I am trying to be helpful and I love and user feedback).
Final Thought
The very concept of the market message should be troubling for active investors. If you think that markets are efficient, you are wasting time trying to gain an advantage. If you deny the efficient market hypothesis, what is the point in searching for a message?
Most cite the market message when it supports their viewpoint and ignore it otherwise.
I recommend that you reach your own conclusions based upon fundamental data. Since my indicators show an improving economy and little recession risk, I interpret the strength in bonds as a reflection of other factors – low inflation expectations, favorable comparisons to European yields, and traders caught "offside" on the bond trade. (I sympathize with that!)
To the extent that the message is inconsistent, I expect yields to rise over the remainder of the year. I do not see "complacency" in the stock market. It is better described as an uneasy balance of nervous viewpoints on both sides.
And by the way….so many treat the VIX as an indicator rather than a market. That is an error. If you really believe that the VIX signals complacency you can step right up and buy options on the underlying stocks or else the VIX itself.
Why would anyone think that the options market is less sophisticated than that for stocks or bonds?

