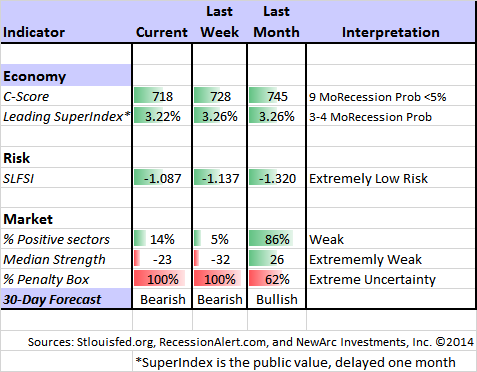
Last week featured a low signal to noise ratio – speech after speech, but little fresh information. This week heralds the start of earnings season. While we have a normal measure of government data, market participants will carefully parse the announcements and conference calls.
This week will be all about earnings.
Prior Theme Recap
In my last WTWA I predicted that the media would focus on the speechifiers, be they central bankers, political leaders, or pundits. This proved to be amazingly accurate. Each of the major speeches was covered extensively and the lesser ones also got significant play. It shows what will happen when there is a vacuum in real news. None of the speeches really broke new ground. We could all have predicted the major theme of each in advance. There was little else to report, and the story had a very negative tone.
Feel free to join in my exercise in thinking about the upcoming theme. We would all like to know the direction of the market in advance. Good luck with that! Second best is planning what to look for and how to react. That is the purpose of considering possible themes for the week ahead.
This Week’s Theme
In sharp contrast to last week’s data vacuum important fresh news about corporate earnings. The stories from around the world will continue, and there is a normal flow of fresh economic data. Despite this I expect the earnings stories to dominate the financial news flow. This is independent, non-government data and it is directly relevant for future market performance. It also provides a fertile source for pundit spinning, always a main driver for financial media.
Can corporate earnings reverse the recent market decline?
Here are some key takes:
- European bad news may already be priced in. (Michael Purves of Weeden).
- Companies might warn of currency issues.
- Disaster impends! You already know how to find ZH— do I need to provide more help?
- A balanced viewpoint from Brian Gilmartin, who looks at specific sectors.
The upcoming earnings week is an important story. I want to provide more emphasis than usual on last week in addition to the week ahead. Please read the investor section carefully for these ideas.
Before turning to my own conclusions, let us do our regular update of the last week’s news and data. Readers, especially those new to this series, will benefit from reading the background information.
Last Week’s Data
Each week I break down events into good and bad. Often there is “ugly” and on rare occasion something really good. My working definition of “good” has two components:
- The news is market-friendly. Our personal policy preferences are not relevant for this test. And especially – no politics.
- It is better than expectations.
The Good
There was not much news. The US economic picture remains solid, while China is a bit weaker and Europe at near-recession levels.
- Jobless claims remain strong. The four-week average is 287K – not the stuff of economic weakness.
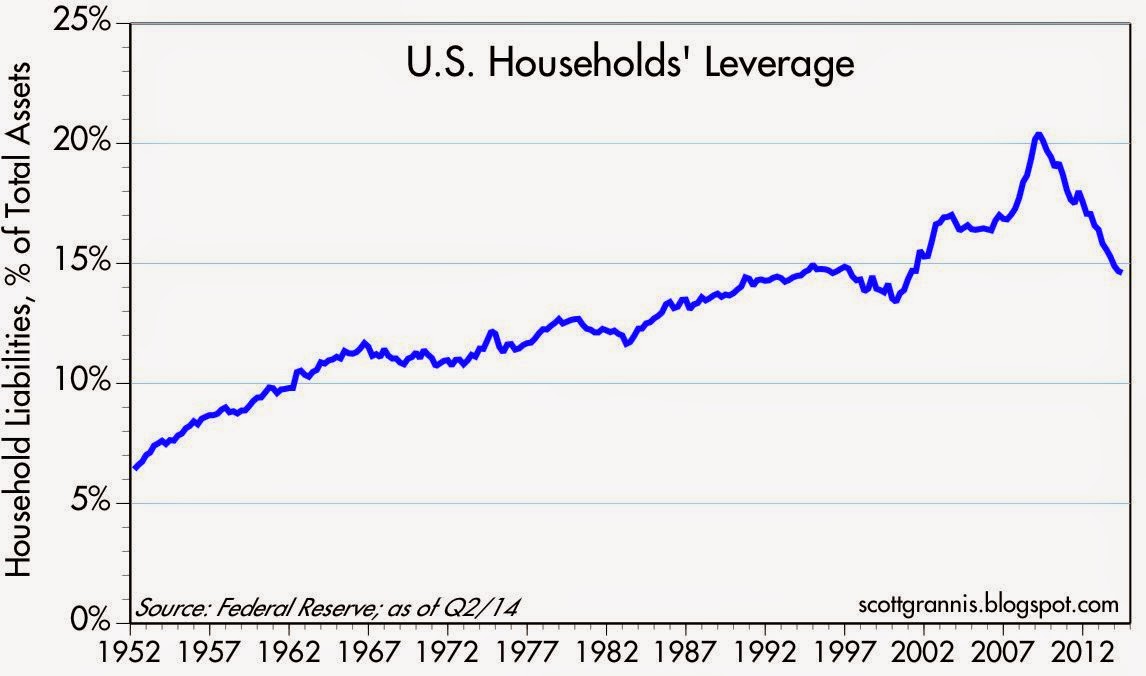
- Household leverage has further declined. It is “back to the levels of the mid- to late-1990s, a period that saw low inflation and strong economic growth. The “bubble” that was created in the runup to the 2008 financial crisis has completely popped. Households have adjusted to new realities, so perhaps we’ll see more normal, less risk-averse behavior going forward.” Scott Grannis.
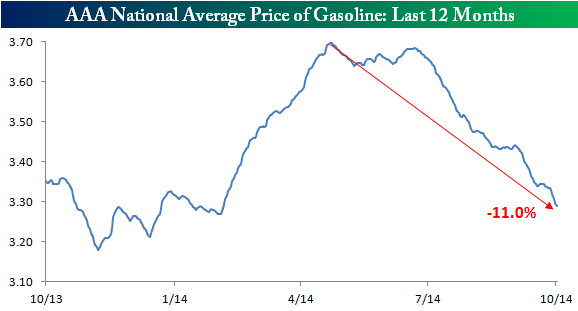
- Gas prices declined again. $3.24 is the lowest in nearly a year. (I am still not seeing this around Chicago). This provides a little extra cash for average consumers. Some will argue that ten bucks a week is not much. Economic analysis is about changes at the margin. Every increase or decrease makes a difference. We noted the negative effects of rising gas prices and now we see the opposite. See Bespoke for analysis and charts. See also NDD for a continuing comprehensive discussion of the effects of energy costs on spending.
- Dollar strength is OK. I am having trouble scoring this point in the weekly ratings. The current market action suggestions that a strong dollar is not market friendly. Long-term analysis shows the opposite. With that warning in mind, please read Neil Irwin’s explanation about how to make inferences about the global economy from the increase in dollar strength. Good stuff, good charts. Also please note the Dudley speech (via WSJ’s Hilsenrath) with an unusual mention of dollar strength. This was also part of the Fed minutes. The Fed does not normally comment on currency matters, so it is interesting to note that it might be a factor in future rate policy.
- US budget deficit declined to $485 B in fiscal 2014 according to the CBO (a good source). This is down almost $200 B from the prior year. Please note the contrast with “fiscal drag” in the bad news. You can’t have it both ways!
The Bad
Most of the bad news was not about the economy. It was about the stock market reaction to last week’s speeches.
- Germany keeps a hard line on European stimulus. Brian Blackstone of the WSJ has a good article on Jens Weidmann, the German Bundesbank President. He opposes what the ECB has already done, not to mention further moves.
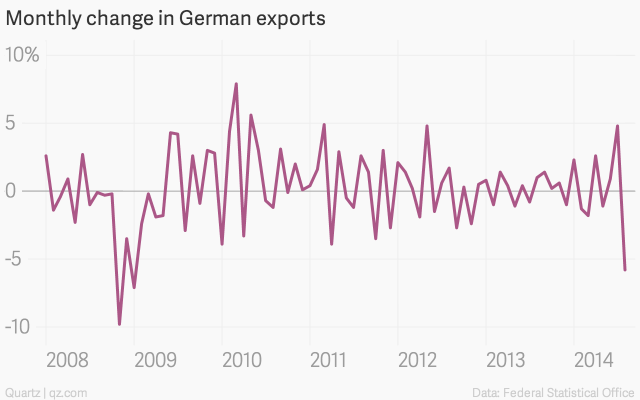
- German exports declined 5.8%. Matt Phillips has a nice summary article with several good charts, including the one below. Please contrast with “hard line” above and various points on Ukraine sanctions.
- US fiscal policy remains a big drag on GDP Growth. I cannot do a good job by reproducing the interactive chart here, so please look at the Brookings analysis and play with it yourself. (HT reader CS).
- JOLTs quit rate was unchanged. Many observers try to use the JOLTs report to interpret net job growth. The regular monthly employment report is better for that purpose. JOLTs is better for business dynamics, including length of time to hire and the quit rate. These were both negative.
The Ugly
This week’s ugly news is the continuing Ebola story. The need for treatment in West Africa and international issues are now both commanding attention. It is a sad commentary that the story only gets big when there is a single US case. The economic effects are still relatively modest overall, but include concentrated effects in some sectors. Airlines are fighting the battle (via the Hill).
The Silver Bullet
I occasionally give the Silver Bullet award to someone who takes up an unpopular or thankless cause, doing the real work to demonstrate the facts. Think of The Lone Ranger.
No award this week, although I see plenty of good candidates deserving sharp analysis and refutation. How about the “Satan Omen?” Nominations always welcome!
Quant Corner
Whether a trader or an investor, you need to understand risk. I monitor many quantitative reports and highlight the best methods in this weekly update. For more information on each source, check here.
Recent Expert Commentary on Recession Odds and Market Trends
Doug Short: An update of the regular ECRI analysis with a good history, commentary, detailed analysis and charts. If you are still listening to the ECRI (three years after their recession call), you should be reading this carefully. Doug includes the most recent ECRI discussion concerning continuing economic weakness in Japan. Doug covers the possible implications for the US. The ECRI has an update criticizing the Fed analysis of labor markets. This deserves discussion, but is beyond our scope in the weekly article.
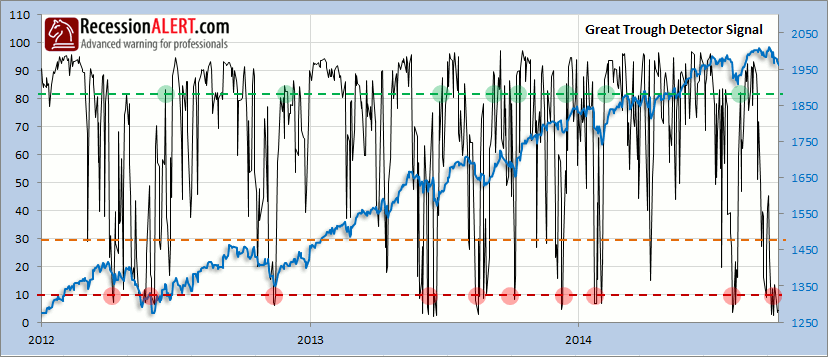
RecessionAlert: A variety of strong quantitative indicators for both economic and market analysis. While we feature the recession analysis, he also has a number of interesting market indicators. His most recent update digs deeper into the breadth deterioration that has been a popular topic over the last few weeks. Dwaine notes the possible actionable events from his most recent Great Trough signal. Read the entire post, but be prepared to add context from your other work.
Georg Vrba: Updates his unemployment rate recession indicator, confirming that there is no recession signal. Georg’s BCI index also shows no recession in sight. Georg continues to develop new tools for market analysis and timing. Some investors will be interested in his recommendations for dynamic asset allocation of Vanguard funds. Georg also is working on methods to improve performance from low-volatility stocks. I am following his results and methods with great interest.
I added to the recession discussion with some comments on the 2011 ECRI forecast and a possible repeat given current commodity prices.
Bob Dieli does a monthly update (subscription required) after the employment report and also a monthly overview analysis. He follows many concurrent indicators to supplement our featured “C Score.” Readers who missed out last week on the WTWA special can still get a free download of Bob’s monthly employment report. Not only does this provide a snapshot of the employment market as of September, there is great historical context. Take advantage while this is still available.
The Week Ahead
We have a more normal week for economic data and events.
The “A List” includes the following:
- Initial jobless claims (Th). The best concurrent news on employment trends.
- Housing starts and building permits (F). Housing remains important and these provide some leading information.
- Michigan sentiment (F). An important read on jobs and spending.
- Retail sales (W). The consumer remains an important read on economic growth.
The “B List” includes the following:
- Beige book (W). Anecdotal information for the next FOMC meeting. All things Fed remain interesting to most.
- PPI (W). No sign of inflation so far, so interest is secondary.
- Industrial production (Th). Rebound in Sept. data for this volatile series?
The speech calendar – loaded up last week – is now at a minimum. Fed Chair Yellen speaks on Friday.
The big stories of the week should come from corporate earnings announcements.
How to Use the Weekly Data Updates
In the WTWA series I try to share what I am thinking as I prepare for the coming week. I write each post as if I were speaking directly to one of my clients. Each client is different, so I have five different programs ranging from very conservative bond ladders to very aggressive trading programs. It is not a “one size fits all” approach.
To get the maximum benefit from my updates you need to have a self-assessment of your objectives. Are you most interested in preserving wealth? Or like most of us, do you still need to create wealth? How much risk is right for your temperament and circumstances?
My weekly insights often suggest a different course of action depending upon your objectives and time frames. They also accurately describe what I am doing in the programs I manage.
Insight for Traders
Felix has continued the bearish call initiated two weeks ago. Most sectors have a negative rating and the broad market ETFs are all negative. The Felix trading accounts were completely invested in three inverse ETFs at one point last week. Trading accounts are now 1/3 inverse, 1/3 bonds, and 1/3 a non-US ETF.
You can sign up for Felix’s weekly ratings updates via email to etf at newarc dot com.
Insight for Investors
I review the themes here each week and refresh when needed. For investors, as we would expect, the key ideas may stay on the list longer than the updates for traders. The recent “actionable investment advice” is summarized here.
Whenever there is a market decline, we are bombarded with “explanations” and predictions of disaster. To keep perspective I want to do three things:
- Discuss what is not happening;
- Re-emphasize the factors linked to major market moves; and
- Consider the best strategy for the current market.
What is not happening
Sometimes you need to begin by clearing away misleading information. Here are assorted explanations that I saw last week:
- QE is ending. Attributing everything to Fed policy is a popular sport, but this is obviously mistaken.
- QE has been declining throughout 2014 and is now down to $15 B from a start of $85 B per month. It is already 80% over.
- Some link the market to the Fed balance sheet. That is at an all-time high and is moving higher.
- Some think the market is anticipating the end of QE. If so, why didn’t it start in December when the tapering was announced?
- Ebola problems. The Ebola story is very bad on a human front, but the economic effects have been limited. There were some moves in airline and travel stocks this week, but the economic estimates were about $32 B. This assumed that steps to control panic would not occur.
- Ukraine. This is also bad news, but not fresh news. The reciprocal sanctions are having an effect. Will policies change?
- ECB inaction. Some expected the ECB to expand bond-buying. Instead Draghi has increased the calls for fiscal policy changes by member nations. This is also not new. While we do not know whether it will eventually be effective, the combination would be better than monetary policy alone.
- Declining commodity prices signaled another recession. In fact, prices are making a natural response to changes in the dollar, with both at normal historical levels. (See Scott Grannis).
- Increased volatility shows that the market will decline further.
- It was only a few weeks ago when the same voices argued that low volatility signaled excessive complacency, a warning of future stock declines.
- Volatility is actually just back to normal levels.
- Someone’s valuation model has been proven accurate. There has been a vigorous debate over valuation methods. Nothing happened to resolve it last week.
- Small caps are lagging, signaling a market decline. When these stocks were strong, it was proof of “froth.” Sheesh! For a nice discussion of this see The Stock Trader’s Almanac.
Factors behind big market declines
The biggest market declines have all involved either a recession (defined as a significant decline from a business cycle peak) or a major increase in financial stress.
- A reason for our extensive weekly discussion of recession chances is the desire to avoid major declines. In addition to the weekly quant corner, take a little time to review my summary on this topic.
- Our weekly table also emphasizes the St. Louis Financial Stress Index. My research identified a value of 1.1 as a place where it would make sense to reduce positions. We did so in 2011. Current risk remains low.
Current best strategy
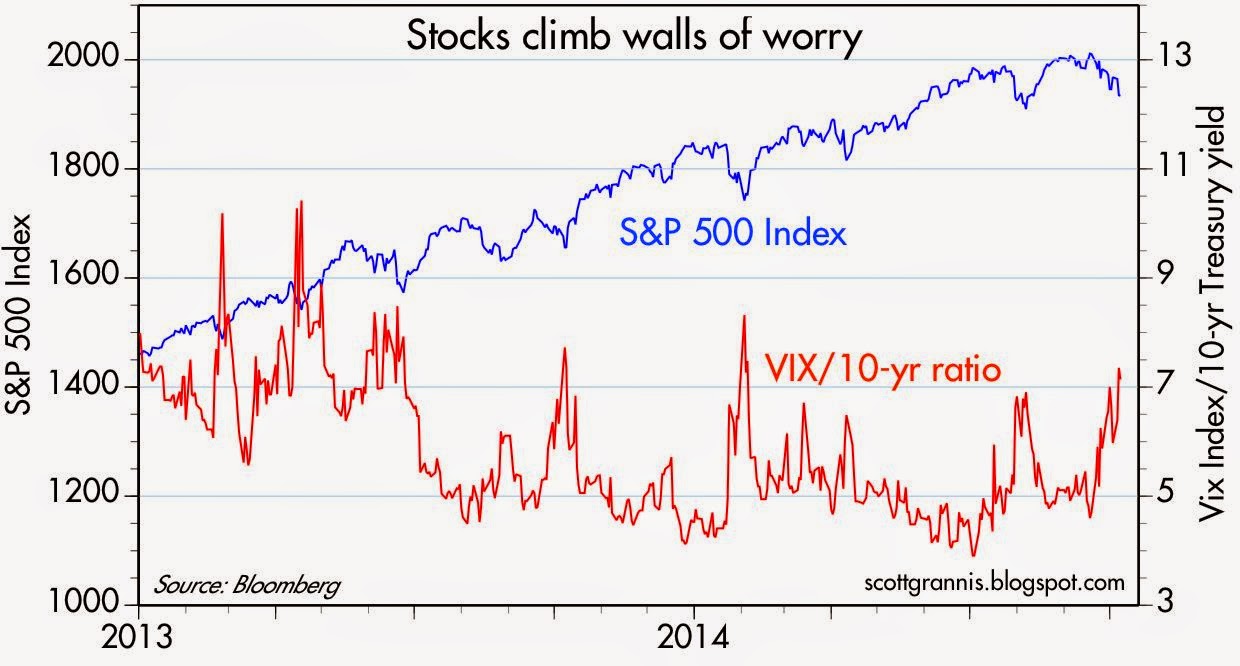
If you have a good investment strategy, it is unwise to overreact to relatively normal fluctuations. Stocks climb a “wall of worry.” This means that the stories you read and see on financial TV are already “in the market.” You need to think about what might be different. This was the key idea behind my controversial call for Dow 20K (story here). Scott Grannis does a nice job with this topic, including this chart of volatility.
If you are a value investor, it is up to you to determine what your investments are worth. If your methods are sound and the market disagrees, then you can use volatility to add more to your most attractive holdings. If you have made a mistake in your choices, you need to re-evaluate and move on. Price is what you pay; value is what you get.
If these fluctuations make you uncomfortable, then it may be right to reconsider your asset allocation.
This approach is basically what Warren Buffett and other leading value investors do. To help you, start reading the work of Chuck Carnevale. He relentlessly focuses on the fundamental value of each stock. Everything he writes has great value. We never buy a stock without consulting his screens as part of the process. While we do not always agree with the final verdict, we always appreciate the analysis. Start with this post, directed at retired investors.
We continue to use market volatility to pick up stocks on our shopping list. We do this because we also sell positions when they reach our (constantly updated) price targets. Being a long-term investor does not require you to “buy and hold.” Taking advantage of what the market is giving you is always a good strategy.
Other Advice
Here is our collection of great investor advice for this week:
- There are plenty of good ideas in this interview with Eddy Elfenbein, one of our favorite sources. He has especially strong advice for young investors – mostly to focus on personal finance issues and defer investing in individual stocks. He also provides insight into his own stock picking methods.
- Tom Lee (via Sam Ro at Business Insider) has four reasons why things will get better for markets.
- Goldman Sachs has a list of expensive stocks to avoid and cheap stocks to buy. Without commenting on the specific names, I have compared the list to our own screens and recommend these articles as a starting point for your own shopping. We own none of the expensive stocks and many of the cheap ones. I also note the concentration of energy, materials, and economically sensitive names in the “cheap” list. This also fits our current sector analysis for long-term investors.
- If you are stuck in gold, you might consult us about our gold bug methadone treatment. If you are out of the market completely, you might want to reconsider your approach. The current economic cycle is in the fifth inning. This is one of the problems where we can help. It is possible to get reasonable returns while controlling risk. You can get our report package with a simple email request to main at newarc dot com. Also check out our recent recommendations in our new investor resource page — a starting point for the long-term investor. (Comments and suggestions welcome. I am trying to be helpful and I love and use feedback).
Final Thought
I do not have a special insight into earnings season, but I do expect a focus on outlook. A skeptical audience will be watching for companies that are worried about a strong dollar or weakness in Europe or China.
I also do not have a personal forecast for next week’s trading. There are plenty of attractive stocks and plenty of funds that are lagging in performance. At some point the psychology will change. Whether it will happen next week is anyone’s guess. There is a fundamental floor on the market.
Last week I invited people to think about some possible positive events. I got very little in the comments on this topic, partly because it is so challenging to do. Let me illustrate with a few ideas. Since they all seem unlikely, no one is thinking about them.
What if China announced a bid for another oil drilling company?
What if Germany became more active in encouraging fiscal policy changes?
What if OPEC signals a change on production limits? The “instant experts” think that the Saudi’s have a deep conspiracy to crush the US fracking industry. What if the explanation is more mundane? (See this source)
What if consumer spending takes a firm upturn in the US? As he does so often, Joe Weisenthal gets the key point right:
One month ago there were literally no bears left. Everyone had flipped bullish, and nobody could think of a good reason for stocks to go down.
And now, people can’t think of any “upside catalysts,” and everyone thinks the markets are going lower.
What’s interesting is that there’s no obvious change of stories. Sure China is slowing, and the European economy is belly flopping. But so? How is that news? It’s not. It just becomes news and becomes significant after the market sells off.

