Highlights- Market Movers: Weekly Technical Outlook
- USD/CAD rally may be petering out ahead of key 1.3400-50 resistance zone
- Look Ahead: Stocks
- Look Ahead: Commodities
- Global Data Highlights
Technical Developments:
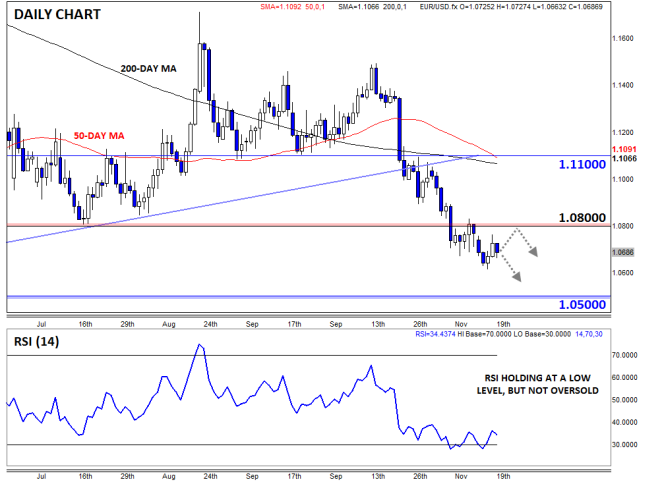
- EUR/USD bias remains lower beneath previous-support-turned-resistance at 1.0800
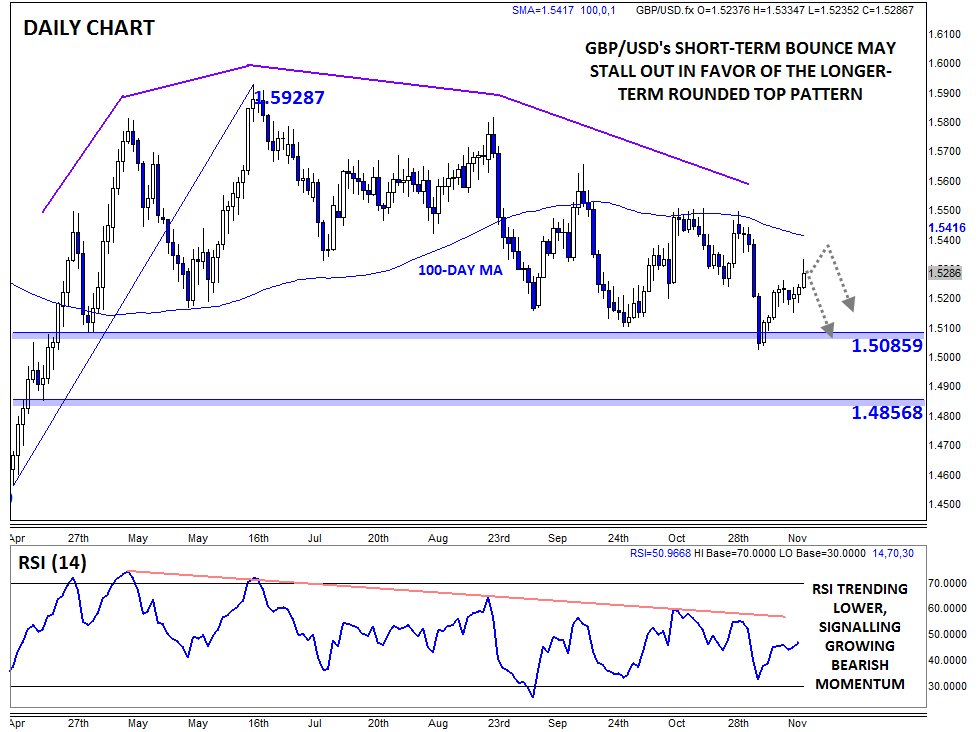
- GBP/USD forming a longer-term rounded top pattern, 100-day MA at 1.5400 could provide resistance
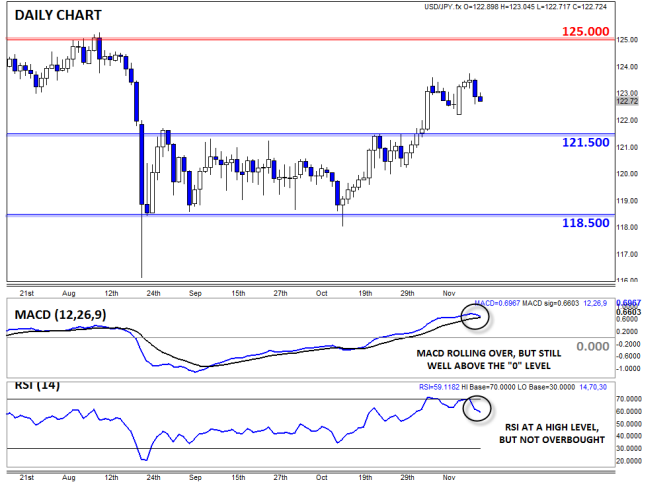
- USD/JPY rally pausing, but more upside is favored above 121.50
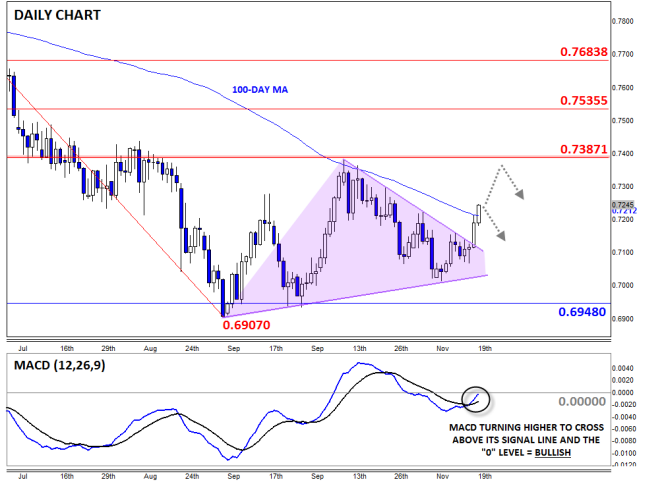
- AUD/USD breaking out of symmetrical triangle pattern – potential for more near-term strength this week
EUR/USD
EUR/USD dipped to a fresh 7-month low earlier this week (the lowest level since “Tax Day” in the United States – April 15) before catching a bid midweek and bouncing back modestly. While the short EUR/USD trade is undoubtedly becoming crowded, it is supported by both fundamental (monetary policy divergence in favor of the US) and technical (established downtrend) reasons. For this week, a bounce back toward key previous-support-turned-resistance at 1.0800 is possible, but the market should look to fade any near-term rallies in favor of the established downtrend.
Source: FOREX.com
GBP/USD
GBP/USD continued to outperform its mainland brother last week, reaching a two-week high in the process. We covered the technical outlook for this pair in depth on Thursday; see “GBP/USD: Low conviction dollar longs jump ship” for more.
Source: FOREX.com
USD/JPY
USD/JPY rallied sharply on Monday after the disappointing Q3 GDP report from Japan, but dollar bulls were unable to maintain the momentum and the pair is trading essentially unchanged on the week as of writing Friday afternoon. We maintain our near-term bullish bias above 121.50, but the bullish case is certainly less compelling than it was a week ago with both the MACD and RSI rolling over. To the topside, the key resistance levels to watch will be this week’s high around 123.60 and major previous resistance near 125.00.
Source: FOREX.com
AUD/USD
AUD/USD is our currency pair in play this week due to a number of important RBA speakers, as well as some important US economic data releases ahead of the Thanksgiving holiday on Thursday (see the Global Data Highlights section below). Our technical outlook for AUD/USD remains unchanged from Thursday – see “AUD/USD: Big triangle breakout could lead to short-term strength” for more.
Source: FOREX.com
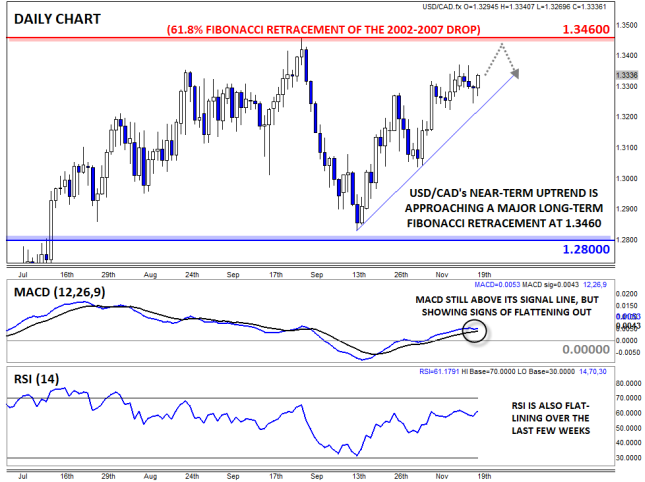
USD/CAD rally may be petering out ahead of key 1.3400-50 resistance zone
It’s been another lackluster week in the battle for 49th parallel currency supremacy. USD/CAD rallied in early November, boosted primarily by better-than-expected economic data out of the US and weakness in oil, a key Canadian export, but the rally is now showing signs of petering out ahead of the key 1.3400-50 resistance zone.
While most traders are probably keyed in on the daily or hourly (or shorter-term!) charts, it’s worthwhile to occasionally check in on the longer-term price action. In the case of USD/CAD, a trader who zoomed all the way out to a monthly chart (not shown) would note that the 61.8% Fibonacci retracement of the entire 2002-2007 decline comes in at 1.3460, within a few pips of the high that USD/CAD set earlier this year. These long-term Fibonacci levels tend to be more reliable than shorter-term levels as they take more traders, trading more money, for longer to create.
The North American exchange rate has already pulled back 600 pips from that barrier, but in the grand scheme of things, that may be relatively small potatoes; after all, we’re talking about a 7100-pip drop and subsequent 4400-pip rally off the 2007 lows.
More immediately, USD/CAD remains in a short-term uptrend, though there are some signs that the trend is losing steam. Notably, the MACD and RSI indicators have both flat-lined over the last few weeks, showing fading bullish momentum. Intraday traders could opt to give the near-term uptrend the benefit of the doubt in the short-term, but medium- and longer-term traders may want to be more cautious below the critical 1.3460 barrier.
Source: FOREX.com
Look Ahead: Stocks
We have published a few bullish reports on the stock markets since the middle of this week after noticing how resilient the markets were following last Friday’s terror attacks in Paris. From a trading perspective, the reaction of the market is always more important than the news itself and this was yet another example of this bullish market behavior. In addition, the FOMC meeting minutes suggested the Fed is likely to increase rates in December. But the US stocks markets have rallied, thereby shrugging off concerns that the slightly higher rates will hold back economic growth there or in emerging markets. Of course, the Fed did say that further rate rises will be very gradual and dependant on incoming data. So, despite the Fed potentially hiking rates in December, it will still remain dovish. In Europe, the European Central Bank is still very dovish of course and is seriously considering increasing the size and composition of its bond-buying program in December. In theory, the euro should continue to move lower, making European exports comparatively competitive, which in turn should help to boost economic growth in the single-currency bloc. Meanwhile, the cheaper borrowing costs means individual and business spending could increase, further fuelling growth, wages and eventually inflation in the Eurozone. At least that is what the ECB is hoping to achieve, anyway.
On Friday, the ECB President Mario Draghi said "we will do what we must” and would seek to get inflation back up to target "as quickly as possible." This was enough to send bond yields further into the negative and with the absence of any other sentiment-sapping news, investors’ confidence grew and they evidently expanded their long equity positions. And who would blame them? After all, yields are universally extremely low, bad news continually gets shrugged off, selling pressures have so far been relatively mild and short, oil prices are low (which is good news for the consumer) and gold and other safe-haven assets are falling—to name but a few bullish indications. Yield-seeking investors are thus left with little choice but to invest in equities which pay decent yields at acceptable levels of risk.
However, there are some headwinds that may cause the markets to fall back next week, including fears about the global economy. In this regard, the latest manufacturing PMI reports from Germany and France in particular, released on Monday, should therefore be monitored closely. On Tuesday the focus will turn to the German Ifo Business Climate, which is a highly regarded survey due to its large sample size and historic correlation with German and Eurozone economic conditions. So, if this shows business confidence is growing once more following the Volkswagen (DE:VOWG_p) emissions scandal and despite the terror attack/threats, then equities should in theory push further higher. Traders may also want to keep an eye on the second estimates of the third quarter GDP in the US and Britain due to be published on Tuesday and Friday, respectively.
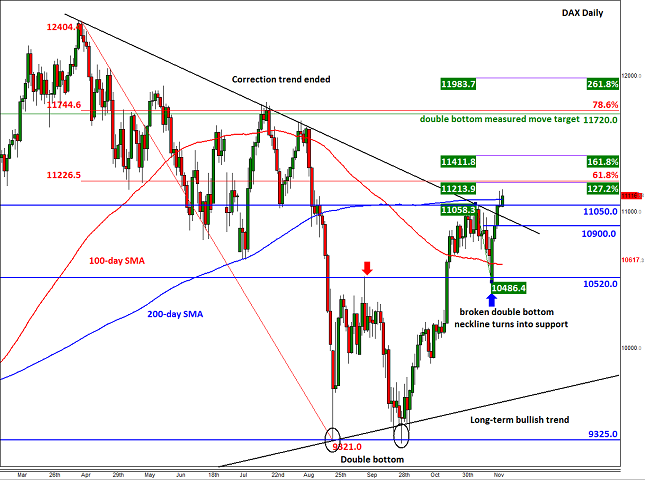
Meanwhile the technical picture of the DAX is looking increasingly bullish and as we had anticipated earlier this week, the index has now broken its corrective trend which had been in place since it achieved a record high in April. This is potentially a significantly bullish outcome and effectively invalidates the previously bearish technical picture. So the DAX could potentially go on to not only revisit but break the record high of around 12400 over time. But we are miles away from that level and traders will need to remain focused and not lose sight of the near-term trend and resistance levels. First and foremost, the bulls need to tackle the 200-day moving average at 11095 as so far we haven’t broken above it on a closing basis. If and when this is put right, the bulls may then aim for the Fibonacci convergence area of 11215/25 where the 61.8% retracement of the drop from the record high meets the 127.2% extension of the most recent downswing. The 161.8% extension comes in at 11410 then there is not much further resistance until the double bottom target and the 78.6% Fibonacci retracement level around 11720/45. So, there’s potential for a BIG rally.
The bears meanwhile will want to first and foremost see another rejection of the 200-day moving average and then hope that the index would fall back below the now broken resistance at 11050. If that happens then there is a chance we will see a sizeable move lower. But as things stand, it is the bulls who are in the driving seat heading into next week.
Source: FOREX.com. Please note this product is not available to US traders.
Look Ahead: Commodities
Commodity prices were stable since Wednesday. Gold managed to gain for a couple of days, copper halted its decline and oil traded sideways. While gold was underpinned by a slightly weaker dollar due to growing expectations of a so-called dovish rate hike from the Fed, copper got a boost in part from zinc, which has rallied sharply after ten Chinese smelters said in a joint statement they would cut output by 500,000 tons next year, reasoning that the current weak prices do not reflect the fundamentals. Commodity giant Glencore (L:GLEN) is already reducing copper production, though so far this has had little or no impact on the metal’s price. Nevertheless, concerns over China appear to have diminished somewhat, so copper could find a near-term base soon, though the long-term trend remains decisively bearish – and not just for copper. Indeed we wouldn’t be surprised if gold starts melting away once more given the surging equity markets and the rebounding US dollar. But with sentiment being so bearish on gold, the probability that we will see a sharp short-squeeze rally is now high, especially if resistance at $1090 breaks.
Meanwhile crude oil has shown signs of stabilization though the bears keep knocking it down each time it tries to break higher. Traders are clearly finding it difficult to decide whether to focus on the short-term bearish or the slightly longer-term bullish supply and demand factors. As things stand, it looks as though not many people are convinced that we will see a notable destocking in global crude stockpiles anytime soon, even if the latest US oil inventories data shows that the pace of the builds there has slowed down. So, oil prices could fall further before we see a noticeable bounce, though that being said they do look severally oversold in the short-term. Baker Hughes (N:BHI) will report its latest rig counts data on Friday evening. The number of active rigs has been consistently falling in recent times as oil prices continue to remain depressed. So far, short-term speculators have hardly reacted to the falls but essentially it does point to a tighter market in 2016. So we could be very close to the bottom for oil.
Technical outlook: Brent
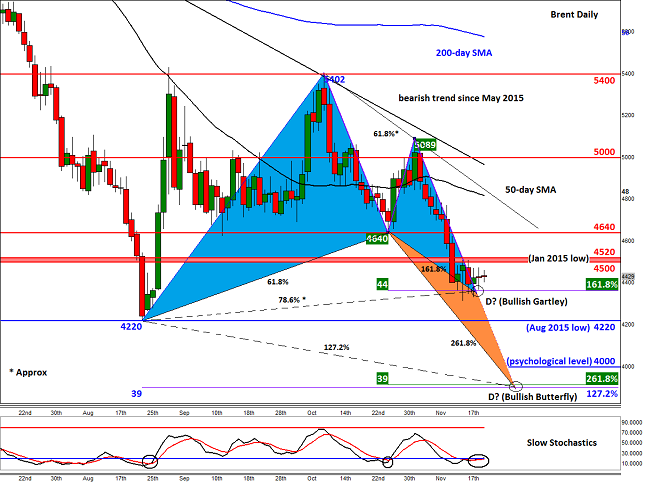
How low can oil go? Brent has found decent support around the $43.50 - $44.00 price range following a big drop recently. As can be seen on the chart, a couple of Fibonacci levels converge with the point D of an AB=CD move here. So, we have a Bullish Gartley pattern here, which can sometimes pinpoint major lows and highs in the markets. So far this pattern is just about holding and we are yet to see a rally. So, at this stage, the bulls should proceed with extreme caution since they would be going against the underlying bearish trend. But if resistance at the $45.00-$45.20 region breaks, then we may see a more aggressive rally at least towards the bearish trends and the 50-day moving average, around $48.00. Supporting the bullish case here is the fact that the Slow Stochastics indicator is at the oversold threshold and potentially about to form a bullish crossover.
Conversely, if oil breaks below the abovementioned Bullish Gartley support, then the next logical target for the bears would be the August low around $42.20. Though there is a possibility for Brent to form a double bottom here, there’s greater risk that it could even extend its drop towards the next psychological level at $40 a barrel. Should we get to these levels, the longer-term bears would need to be extremely cautious for there is a more significant harmonic price pattern that could provide a floor to prices: a Bullish Butterfly around $39. This formation is the same as the Gartley in that it is constructed by Fibonacci levels, but the point D comes in below the 100% retracement of XA, in this case at the 127.2% extension level. The CD leg is also extended – in this case, by 161.8 per cent times AB. The area around $39 is also where the 261.8% of the BC move resides, thus making it an exhaustion point. But will oil even get to $39 and even if it does, will necessarily form a major base? Indeed, we could simply see a short-term bounce, before the trend resumes and oil prices fall further. So treat all these Gartley/Butterfly and indeed any other technical patterns with caution, especially when going against the underlying trend.
Source: FOREX.com. Please note this product is not available to US clients
Global Data Highlights
Monday, November 23
9:00 GMT - Eurozone Flash PMI Readings
Both the Services and Manufacturing PMI surveys from the single currency zone will be released Monday morning. Unlike in the US, the two major sectors of the Eurozone economy have been moving mostly in lockstep, and both readings are once again expected to print in the 52-54 zone, showing modest growth.
15:00 GMT – US Existing Home Sales
It will be a relatively quiet week for US data ahead of the Thanksgiving holiday, but there are still a couple of reports worth monitoring, including Monday’s Existing Home Sales reading. Home sales have generally been moving higher over the course of the year, though traders and economists expect a slight dip to a 5.41M annualized rate of sales from 5.55M last month.
Tuesday, November 24
8:15 GMT – Swiss Q3 Employment Report
Switzerland only releases key economic data quarterly, so the releases tend to have a relatively large impact on the value of the franc. Switzerland’s labor market has held steady at about 4.23-4.24M workers throughout the year and with Switzerland’s close trading partners in the Eurozone likely to expand monetary stimulus, this week’s jobs report will take on even more significance for the Swiss National Bank.
9:00 GMT – German IFO Business Survey
One of the Eurozone’s most timely economic releases is scheduled for release on Tuesday. This survey of over 7,000 manufacturers, builders, wholesalers, and retailers covers a wide swath of the Eurozone’s most important economy and therefore tends to have a big impact on the euro and Eurozone equities. In particular, traders will key in on the “future expectations” component of the survey for a read on how worried businesses are about the economy moving forward.
13:30 GMT – US Preliminary Q3 GDP Report
Despite the “Preliminary” moniker, this report is actually a revision of the Q3 GDP report released last month. Readers will recall that the “Advance” GDP report last month printed at 1.5%, down sharply from 3.9% growth in Q2, but with improvements in some of the data released since then, economists expect the Q3 figure to be revised up to 2.0% annualized growth. Obviously, a stronger-than-anticipated reading would create more confidence in the Federal Reserve raising interest rates in December, with likely bullish implications for the US dollar.
15:00 GMT – US Conference Board Consumer Confidence
Another timely economic survey, this time out of the US, will be released just 90 minutes after the GDP report. Consumers have remained resilient over the entire year, with this measure hovering around the 100 level (highest reading since 2007) since January, despite economic concerns and fluctuating gas prices. Another strong reading of 99.3 is anticipated this week, and a move back above the 100 level could provide a boost to the greenback.
Wednesday, November 25
13:30 GMT – US Durable Goods Orders
Durable goods are products expected to last at least three years and tend to be bigger-ticket items, so this report can provide another reading of consumers’ confidence in future economic conditions. On a month-by-month basis, durable goods can be very volatile, but the market is currently anticipating the figure to show 1.6% growth (0.5% on “core” durable goods) after two consecutive months of declines.
15:00 GMT – US New Home Sales
The new home cousin to the existing home sales report that will be released on Monday. This report is expected to show a 500k annualized rate of growth after last month’s disappointing 468k reading. While the market (and us) expects a bounce back here, another disappointing release could raise concerns about this critical sector of the US economy, especially with the Fed considering raising interest rates next month.
Thursday, November 26
0:30 GMT – AU Q3 Private Capital Expenditures
With the US on Thanksgiving holiday, Thursday’s trading may be somewhat subdued. That said, Australia’s quarterly Private Capital Expenditures report could lead to some isolated volatility in the Aussie and Australian equities. Capex has fallen for three consecutive quarters and traders are anticipating another contraction, this time of -2.8% over the last quarter.
Friday, November 27
9:30 GMT – UK GDP (2nd estimate)
Just like the US, the UK will release its revised Q3 GDP reading this week. While it’s unlikely to have an outsized impact on the market, we could still see some movement in the pound, FTSE 100, and gilts. As of writing on Friday afternoon, the market has priced in an unchanged reading from last month’s 0.5% quarter-over-quarter growth.
