Market Movers: Weekly Technical Outlook
Technical Developments to Watch:
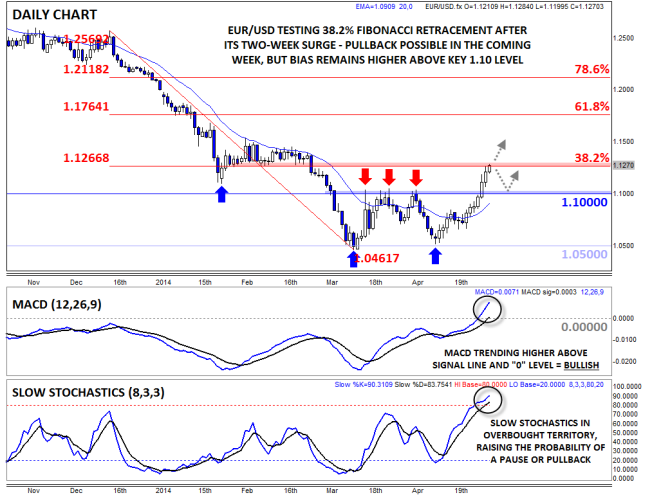
- EUR/USD testing Fibonacci retracement resistance at 1.1270 after last week’s big surge
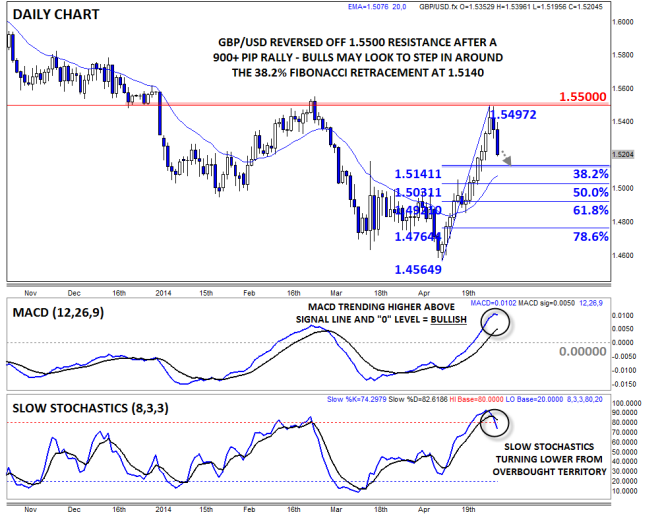
- GBP/USD approaching support at 1.5140
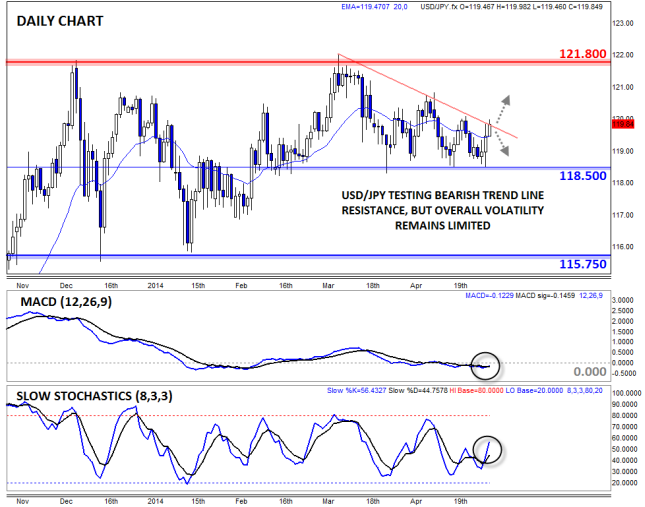
- USD/JPY testing bearish trend line resistance at 120.00
- AUD/USD in play, selling off ahead of RBA meeting on Tuesday
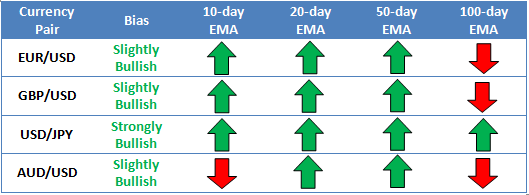
* Bias determined by the relationship between price and various EMAs. The following hierarchy determines bias (numbers represent how many EMAs the price closed the week above): 0 – Strongly Bearish, 1 – Slightly Bearish, 2 – Neutral, 3 – Slightly Bullish, 4 – Strongly Bullish.
** All data and comments in this report as of Friday’s European session close **
EUR/USD

- EUR/USD exploded higher last week, blasting through resistance at 1.10 on the way up to 1.1250
- MACD shows bullish momentum, but Slow Stochastics now overbought
- Medium-term bias remain bullish as long as rates hold above 1.10
EUR/USD exploded higher last week, driven primarily by a broad-based short squeeze and technical buying as the pair broke out of its 7-week range from 1.0500 to 1.1000. On the whole, the pair tacked on over 300 pips last week, and the momentum (as measured by the MACD) is signaling an outright shift to bullish momentum. That said, the Slow Stochastics are now in overbought territory above 80, so a pause or near-term dip is possible off 38.2% Fibonacci retracement resistance at 1.1270 early next week. Nonetheless, the medium-term bias has now shifted to the topside and will remain there as long as EUR/USD holds above 1.10.
Source: FOREX.com
GBP/USD

- GBP/USD surged to 1.5500 before pulling back slightly
- MACD remains in bullish territory, but the Slow Stochastics are turning lower from overbought
- Chance for a pullback as long as 1.55 resistance holds
GBP/USD extended its big rally in the first half of last week; at one point, the pair was trading up a staggering 930 pips from its level just three weeks ago, though sellers stepped in aggressively to push the pair down 300 pips in the last 48 hours of the week. With the Slow Stochastics rolling over from overbought territory, a deeper retracement is in play this week, but traders may look at any dips toward the shallow 38.2% Fibonacci retracement at 1.5140 as a possible opportunity to join the recent uptrend at value.
Source: FOREX.com
USD/JPY

- USD/JPY tested 118.50 support last week, but bounced toward 120.00 to close the week
- MACD and Slow Stochastics show balanced, two-way trade
- All eyes on bearish trend line resistance near 120.00
USD/JPY dipped down to test 118.50 support last week before rallying back up to its declining resistance near 120.00 as of writing on Friday afternoon. More broadly, the unit remains trapped in a tight sideways range between support at 118.50 and resistance up at 121.80 for the twelfth consecutive week. With neither the MACD nor the Slow Stochastics offering a clear signal, more consolidation in the recent range is probable this week, but if we do see a breakout above trend line resistance near 120.00, a move up toward 1.2100 or 1.2180 is possible next.
Source: FOREX.com
AUD/USD

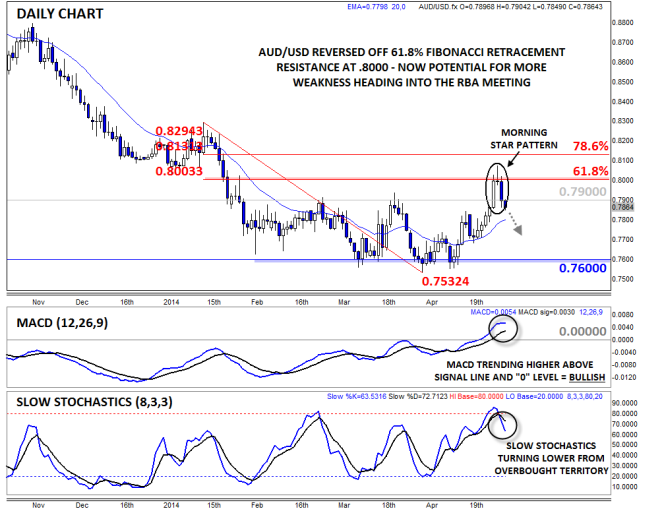
- UDUSD surged to nearly .8100 on Wednesday before reversing sharply back to the downside
- MACD still shows bullish momentum
- Bearish candlestick pattern points to more potential downside this week
AUD/USD is our currency pair in play this week due to a number of high-impact economic reports out of Australia, China, and the US (see “Data Highlights” below for more). Last week, AUD/USD surged all the way up to nearly .8100 on Wednesday before revering sharply back to the downside on Thursday and Friday. This price action created a clear Evening Star*candle on the daily chart, and with the break back below the key .7900 level, more downside is favored heading into the RBA meeting on Tuesday.
* An Evening Star candle formation is relatively rare candlestick formation created by a long green candle, followed a small-bodied candle near the top of the first candle, and completed by a long-bodied red candle. It represents a transition from bullish to bearish momentum and foreshadows more weakness to come.
Source: FOREX.com
Central Bank Wash Up
Last week the market bore witness to numerous important central bank policy meetings, all of which are having dramatic repercussions for their respective domestic currencies. Most of these central banks, including those in Brazil, Russia, Japan and NZ, are more dovish than hawkish. But the most notable exception is the Fed, which is still looking to hike interest rates, but even its tightening schedule has been pushed back almost indefinitely. The repercussions from these meetings are flowing through the FX market and moving all currency pairs in their path.
The Fed’s Maintains the Status Quo
The Fed was the first major central bank to meet, but it was perhaps the most uneventful major policy meeting of the week. The FOMC remains in wait-and-see mode but it’s looking more and more likely that the bank may not raise interest rates at all this year, which is significantly more dovish than earlier predictions that it would raise interest rates around mid-year. Persistent weakness in most parts of the US economy is driving the Fed into a more dovish stance; thus, the market is going to remain on data watch this week. More soft economic data may continue to weigh on the US dollar, although this will have to be weighed against more dovish tones from central banks in other parts of the world.
Too Early to Rule Out QQE3 in Japan
The Bank of Japan (BoJ) is one such central bank, after revising down its growth and inflation forecasts at its policy meeting last week. For FY2015, the central bank cut its forecasts for core inflation and GDP to 0.8% and 2.0%, from 1.0% and 2.1% in January, respectively. The BoJ now only expects core CPI to reach 2% in FY 2016, well beyond its original forecasts that dictated Japan reach 2% inflation by April this year, despite the introduction of QQE2 in October last year. There is some hope on the horizon for the BoJ, particularly with the success of the wage negotiations in the spring and an uptick in core-CPI in March to 0.2%, but we definitely haven’t ruled out QQE3. The prospect of further easing in Japan is likely to keep the yen on the back foot, or at least put a cap on JPY gains until we see further signs of life from the economy.
The RBNZ Turns from Hawk to Dove
In NZ, the Reserve Bank of NZ (RBNZ) introduced a more dovish tone and assaulted the kiwi. The bank replaced its old line that it was expecting a period of stability in the cash rate and future adjustments would depend on economic data, with a more dovish line:
“The timing of future adjustments in the OCR will depend on how inflationary pressures evolve in both the non-traded and traded sectors. It would be appropriate to lower the OCR if demand weakens, and wage and price-setting outcomes settle at levels lower than is consistent with the inflation target.”
Governor Wheeler also fired some aggressive comments at the kiwi, saying:
“On a trade-weighted basis, the New Zealand dollar continues to be unjustifiably high and unsustainable in terms of New Zealand’s long-term economic fundamentals. The appreciation in the exchange rate, while our key export prices have been falling, is unwelcome.”
This powerful one-two punch hit the NZD/USD hard and may keep the commodity currency depressed in the near-term, although stronger-than-expected employment data this week could change the kiwi’s trajectory.
Can We Expect a Rate Cut in Australia?
The next big central bank meeting is at the Reserve Bank of Australia (RBA) on Tuesday (0430GMT). The difference between this bank and the aforementioned central banks is that the RBA is heading in the opposite direction, at least for now. The market has been looking for the RBA to cut the official cash rate at its last two meetings, but both times the bank has decided to leave the official cash rate on hold at 2.25%. This time around the market still expects the RBA to lower the OCR by 25 basis points, but by a smaller margin than at previous meetings.
According to the OIS market Down Under, there’s around a 60% chance that the bank will lower the OCR to 2.00% (23 of 27 economists surveyed by Bloomberg forecast the RBA to cut the official cash rate by 25bps in May), with the release recently of stronger than expected CPI and employment figures pushing some doves to the sidelines, including us. No matter what the RBA does, the Australia dollar is in for another wild ride and can expect another tongue lashing from Stevens.
Look Ahead: Stocks
On Friday morning when this report was written, the FTSE had started the new month on the front foot following a sharp drop at the end of April. Despite that late sell-off, the UK index still ended the month with a gain of about 2.5%. In contrast, the S&P 500 only managed a gain of about 1% over the month while the German DAX index ended almost 4.5% worse off. To some degree, the FTSE’s relatively better performance in April was due to the rebounding oil prices which lifted energy stocks, a sector which had previously weighed on the commodity-heavy index. Also supporting the FTSE has been the mixed-bag UK company earnings and a somewhat positive sentiment on Wall Street thanks to mostly better results there.
European shares in contrast were helped lower in part by a rebounding euro which undermined stocks of export-oriented companies – most notably in Germany – and continued uncertainty over the future of Greece. But now we are in the month of May in which the oft-quoted phrase “sell in May and go away” may play at the back of some investors’ minds and thus discourage them from adding to their positions. Indeed next week could be a tricky one for those who would like to invest in the UK markets due to the growing uncertainty about the country’s political situation. With not long to go until the general election on May 7, opinion polls point to a hung parliament. With the major party leaders having ruled out various coalitions, no one knows for sure who will govern Britain as it could involve several parties this time.
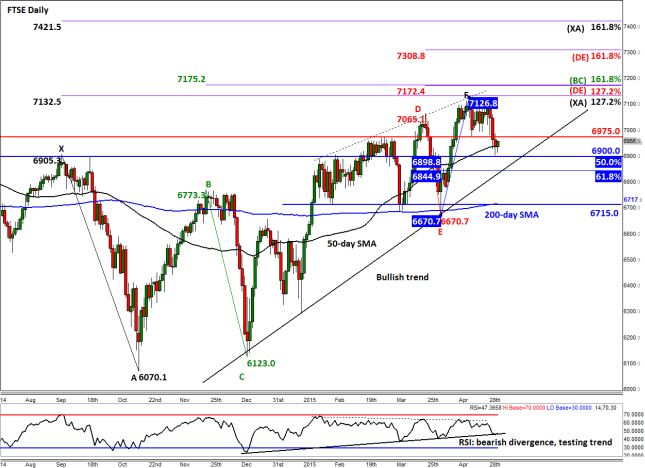
From a technical point of view, the near-term direction of the FTSE remains unclear, although encouragingly for the bulls the index did find some support at the end of the week just ahead of the 6900 level. It is important to remember the significance of 6900; traders may recall that this had been a major resistance area thought 2014 and early this year. Now that it has been broken, this level is a primary reference point for the bullish speculators and is in their interest to defend it.
That said however the significance of 6900 has been eroded somewhat after the whipsaw we saw in March. Nevertheless the index has bounced back here and the technical outlook is on the verge of turning back bullish. This depends to some degree on whether the buyers will be able to push the FTSE above the broken support at 6975 and hold there on a closing basis. If successful, the path of least resistance would be to the upside once more next week. As a result, it is possible that the FTSE may make a move towards the Fibonacci extension levels at virgin territories, shown on the daily chart, soon.
However, there is no guarantee that the index will break back above the old support at 6975 and even if it does, the potential follow-up technical buying may not be that strong with the UK election looming. After all, the RSI is clearly in a state of bearish divergence with the index, correctly suggesting that the bullish momentum has been weakening. The RSI is now testing its bullish trend and if it were to break this then the underlying FTSE index may do the same soon. The trend line on the FTSE comes in somewhere around 6845. Significantly, this level also corresponds with the important Fibonacci retracement level of 61.8%.
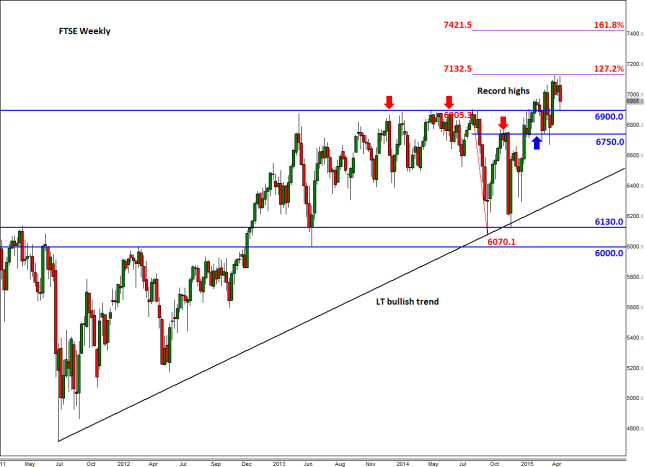
Thus, a potential break below it may lead to a much larger correction towards at least the 200-day moving average at 6715 and possibly towards the long-term bullish trend that is visible on the weekly chart. In a nutshell then, the FTSE is trading at a key technical juncture ahead of the UK general election. From here it could therefore move strongly in one or the other direction, possibly once the outcome of the election is announced. But next week we will also have several high-impact data releases too (see the “Global Data Highlights” section, below) so there should be plenty of trading opportunities.
Source: FOREX.com. Please note this product is not available to US clients
Look Ahead: Commodities
Gold traders have endured – or enjoyed – a very volatile week: the metal surged higher on Monday and Tuesday before falling equally strongly to end the week. On Thursday alone it dropped by a good $30 at one stage. Evidently, the spike in volatility was due largely to the dollar. The rally at the start of the week had corresponded with a sharp sell-off in the dollar which dropped on the back of some weaker-than-expected economic data. Likewise, the bear stampede in the second half of the week was in response to mostly stronger US data which suggested that the Fed may have been correct in their assessment of the economy after all. In Wednesday’s policy statement, the central bank had acknowledged the slowdown in activity, but said the risk to the economic outlook was still “nearly balanced” as it blamed “transitory factors” behind the soft data in Q1.
Some market participants had prepared for a more dovish statement than that, so this was mildly bullish for the dollar – and bearish for commodities priced in the US currency. Judging by some of this week’s data releases, the Fed’s less pessimistic view of the economy can arguably be understandable. After all, the latest jobs data showed that the number of people seeking unemployment benefits dropped last week to 362,000 from 296,000 previously – its lowest level in 15 years, no less. This has raised expectations that next week’s employment report will show a strong rebound in the number of jobs created in April.
As a result, the dollar has managed to bounce back a touch and global equities pared their losses on the back of more good news from Corporate American and on receding concerns over Greece. All this meant therefore that there wasn’t much appetite for safe haven assets such as gold and silver. The usual end-of-the-month reshuffle by some money managers may also have had a part to play in gold’s plunge. Next week’s key data releases should keep volatility in the FX and commodity markets elevated. So there could be plenty of trading opportunities in gold.
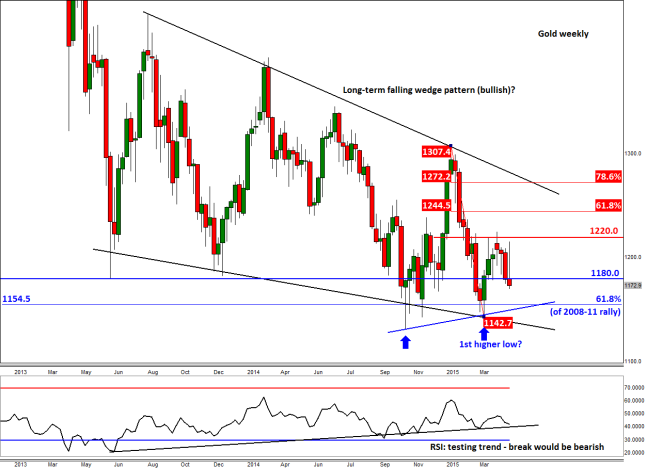
As a result of this week’s sell-off gold has broken the key support at $1180 and is looking to extend its losses further at the start of next week. However this is not the first time that the yellow precious metal has traded below this level. As can be seen on the weekly chart, the metal traded below $1180 for a number of weeks at the end of last year and start of this before staging a rally. Then it found support from various sources including the trend line of a potential falling wedge pattern and also the long-term 61.8% Fibonacci retracement at $1154/5. Could it find support from around this area once again next week or the one after? Time will tell. But gold may have already formed a higher low at the start of this year when it bounced off $1143. As a result, a potential bullish trend line has now been established (in blue on the chart). That said, however, if gold goes through this trend line then that could be a warning sign for things to come.
Global Data Highlights
Monday, May 4, 2015
7:55 GMT German Markit Final Manufacturing PMI (April)
A majority of the manufacturing that goes on in the Eurozone happens in Germany, so this metric is actually more telling than the Eurozone Final Manufacturing PMI. Recent reports have seen this go higher, increasing each of the last three months, but the Flash data didn’t fare so well, falling back down to a 51.9 from 52.8 previous. While the world is fully aware that the Eurozone is struggling, an indication that Germany may be as well would dash hope of a quick euro recovery.
Tuesday, May 5, 2015
4:30 GMT Reserve Bank of Australia’s Monetary Policy Decision and Rate Statement
RBA Governor Glenn Stevens isn’t shy about telling anyone and everyone that he would prefer the AUD to be lower. His closest counterpart, the Reserve Bank of New Zealand’s Graeme Wheeler, indicated the same thing about the NZD this past week. The two antipodean nations are closely related in terms of geography and trading partners and their monetary policy tends to run along the same tracks as well. Considering the dovishness of the RBNZ, it wouldn’t be surprising to see something similar from the RBA.
Tentative Global Dairy Trade Price Index
New Zealand is highly dependent upon the health of the milk industry, and according to the GDT Price Index, there isn’t much to celebrate lately. Milk product prices have dropped for three straight auctions and for the NZD to get any traction, this report may need to print in positive territory.
22:45 GMT New Zealand’s Employment Change and Unemployment Rate (Q1)
This is the first in a long line of employment reports this week, but it isn’t measuring the activity of last month, but all of Q1 2015. If recent reports are anything to gauge opinion on, we should probably have a pretty good feeling about this one. Out of the last eight releases of employment for New Zealand, only one of those quarters failed to achieve the consensus expectation. Last quarter’s 1.2% rise tied for the second best increase since that streak started, but storm clouds have been on the horizon in New Zealand over the last couple months. The tone of the RBNZ could have been a giant red blinking warning sign that something ominous is approaching with this release, so caution may want to be taken heading into it.
Wednesday, May 6, 2015
8:30 GMT UK Markit Services PMI (April)
The services industry in the UK is much like that in the US, it dominates the employment and GDP realm. Therefore, decent figures are always sought and often times delivered. Last month’s 58.9 was the strongest release since September of last year, and bodes well heading in to the UK election season. However, the Services PMI figure has alternated between good and bad over the last six releases, and if that trend continues, then consensus might be a little too optimistic for this release. Either way, much of the attention for the GBP will be gazing upon the last hours before elections, and may not even pay this much attention at all.
9:00 GMT Eurozone Retail Sales (March)
Last month was pretty disappointing for sales in the Eurozone as they fell 0.2%, missing expectations and reversing the string of three straight beats previous. Now that the European Central Bank is partaking in Quantitative Easing, money is easier to get for the banks, but likely not yet for the consumers. Assuming that effect hasn’t yet trickled down, this next release may not be all that encouraging either.
12:15 GMT US ADP Employment Change (April)
The ADP release last month gave a pretty accurate read on the disaster that was to come with Non-Farm Payroll a couple of days later by only growing 189k. Sure, it wasn’t quite as bad as the 129k surprise the market was blindsided by last month, but a miss was still foreseen. Perhaps investors will be paying more attention to the ADP this time around to see if it will once again give us a head’s up to something either good or bad later in the week.
13:15 GMT Federal Reserve Chair Janet Yellen Speech
The FOMC meeting this past week sounded slightly less dovish than the market anticipated heading in to it with the bad NFP, inflation that hadn’t knocked anyone’s socks off, and overall economic malaise. However, Yellen and her band of merry bankers classified the economic misses as transitory thanks to weather and low oil prices, and deleted all references to specific forward guidance. The meeting wasn’t followed by a press conference, so this will be our first chance to hear from the Fed Chair since that decision. If she rules out a rate hike in June in this speech, equities may be the biggest benefactor.
Thursday, May 7, 2015
All Day UK Parliamentary Elections
We could fill this space with loads of information about these elections and their potential impact, but we’ve already done it elsewhere. Take a look at our special report here.
1:30 GMT Australian Employment Change and Unemployment Rate (April)
Outside of one release over the last six months, Australian employment has been pretty hot. All but one of the employment releases either matched or bettered consensus, and many of them weren’t even close. Last month’s 37.7k is pretty indicative of the current run, but once again, the RBA doesn’t appear too convinced that this is sustainable. The continuous warnings about an overvalued AUD have them feeling pessimistic, and the market may catch up to their feelings, particularly if this employment result fails to impress.
23:50 GMT Bank of Japan Monetary Policy Meeting Minutes
These minutes aren’t for the BoJ meeting that just took place this past week, but for the meeting previous to that meeting. Since they did nothing at both meetings, it is logical to assume that the minutes won’t reveal too much concern about their current situation, but if they reveal that a potential QQE increase may have been on the table at this most recent meeting, the JPY crosses could have a field day.
Friday, May 8, 2015
Tentative Chinese Trade Balance (April)
Last month’s Chinese Trade Balance was downright terrible as the market was anticipating something strong (43.3B), but was given something anything but (3.1B). There have been rumors and innuendo about a Chinese slowdown for years due to many assuming 7%+ growth per quarter has to slow down sometime, but many of those predictions ended up being way off as the Asian Giant kept on rolling. That may end up being the case again this time, but such a large miss on such a vital part of the Chinese economy has more eyes upon it this time, and if it prints around these figures again the AUD and NZD may be the biggest losers.
12:30 GMT Canadian Net Change in Employment and Unemployment Rate (April)
Things are looking up for Canada lately thanks to the Bank of Canada becoming more optimistic, oil prices going higher, and employment looking healthy. There have now been three straight good surprises for employment in the Great White North which has helped the USD/CAD break out of its months long sideways trend. If the Canadian fell good train can keep on keeping on, the CAD may be the most likely currency to take King Dollar’s spot on the currency throne.
14:00 GMT US Non-Farm Payrolls and Unemployment Rate (April)
By now you are likely well aware of the abysmal NFP release last month that broke the string of 12 straight releases of 200k or greater. While last month’s figure could still be revised to keep the streak intact, it was still quite surprising to see such a woeful number after having gotten used to such good figures. For all those traders out there who have been holding out hope for a June interest rate hike from the Fed, this NFP figure may have to be 250k+ once again to give it any chance of coming to pass.
