Market Movers: Weekly Technical Outlook
Technical Developments to Watch:
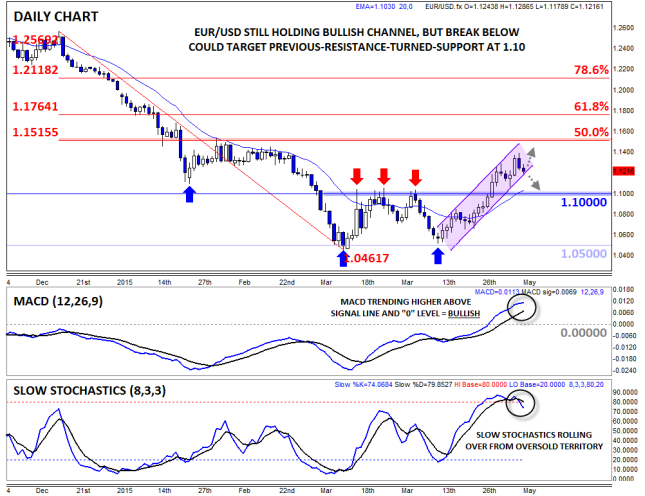
- EUR/USD hanging on to bullish channel support at 1.1200
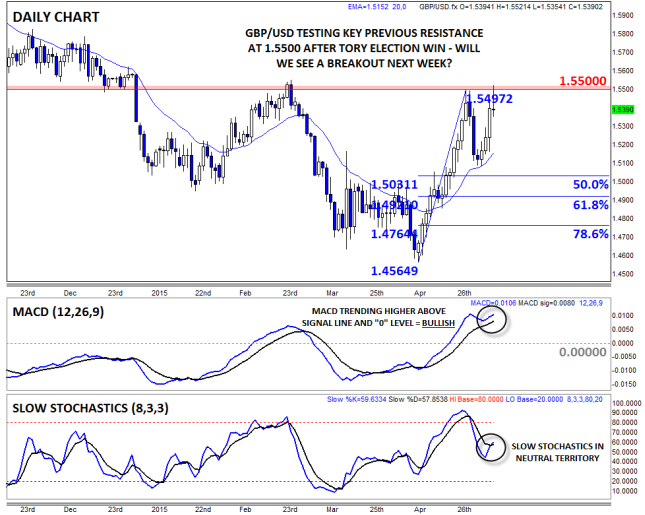
- GBP/USD rallied up to resistance at 1.5500 after Tory majority in UK Election
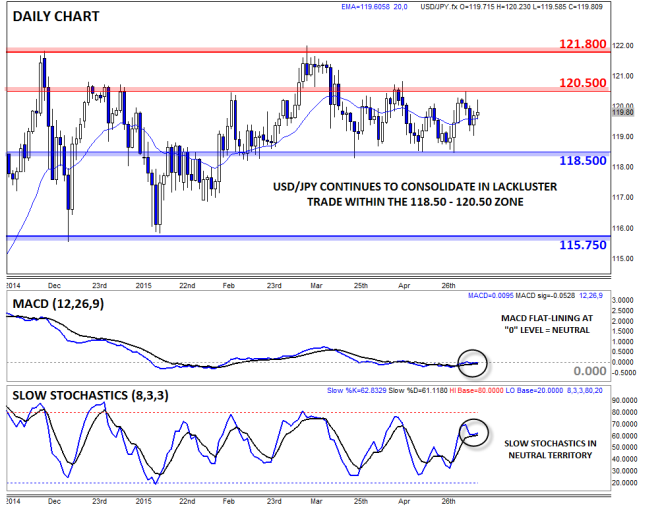
- USD/JPY still rangebound between 118.50 support and resistance at 120.50
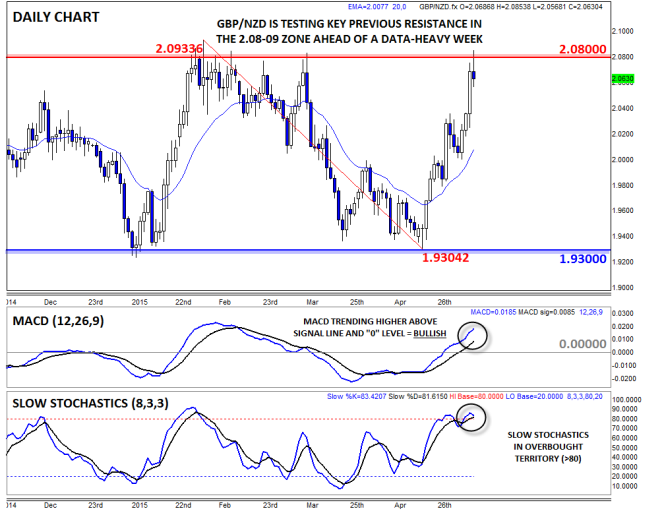
- GBP/NZD in play, key resistance looms at 2.0800
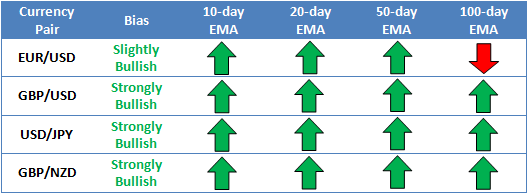
* Bias determined by the relationship between price and various EMAs. The following hierarchy determines bias (numbers represent how many EMAs the price closed the week above): 0 – Strongly Bearish, 1 – Slightly Bearish, 2 – Neutral, 3 – Slightly Bullish, 4 – Strongly Bullish.
** All data and comments in this report as of Friday’s European session close **
EUR/USD

- EUR/USD rallied early last week before pulling back to finish essentially unchanged
- MACD shows bullish momentum, though Slow Stochastics are rolling over from overbought levels
- Medium-term bias remain bullish as long as rates hold above 1.10
EUR/USD rallied to a three-month high near 1.1400 on Thursday before pulling back to finish essentially unchanged on the week. The early week rally was supported by an unexpected surge in German Bund yields, reducing the appeal of short-euro carry trades. On a technical basis, the MACD is trending higher above its signal line and the “0” level, showing clear bullish momentum, though the Slow Stochastics are rolling over from overbought territory above 80. Nonetheless, the medium-term bias has now shifted to the topside and will remain there as long as EUR/USD holds above 1.10, with near-term support at the bottom of the bullish channel at 1.12.
GBP/USD

- GBP/USD surged back to 1.5500 resistance last week
- MACD remains in bullish territory
- Watch for a break of the near-term 1.5100-1.5500 range as traders digest the UK election results
GBP/USD traded sharply higher on the week in anticipation of the UK election. The pair initially spiked when the surprise Tory majority was declared, but the unit has faded back to 1.5400 as of writing. On a technical basis, the pair has strong support at its 20-day MA near 1.5100, while resistance looms up at the aforementioned 1.5500 level. As for the secondary indicators, the MACD is still showing bullish momentum, while the Slow Stochastics indicator is in neutral territory. For this week, we’ll be watching for a breakout from the 1.51-1.55 zone to signal whether the market views the UK election results as bullish or bearish for the currency.
USD/JPY

- USD/JPY pulled back from 120.50 resistance early last week
- MACD and Slow Stochastics show balanced, two-way trade
- Bias remains neutral within recent 118.50-120.50 range
USD/JPY pulled back from previous resistance at the 120.50 level in subdued trade last week. More broadly, the unit remains trapped in a tight sideways range between support at 118.50 and resistance up at 120.50 for the sixth consecutive week. With neither the MACD nor the Slow Stochastics offering a clear signal, more consolidation in the recent range is probable this week, but if we do see a breakout above 120.50, a move up toward 121.80 is possible next.

- GBP/NZD surged over 800 pips from Tuesday low at the key 2.00 level to Friday’s high near 2.08
- MACD still shows bullish momentum, though the Slow Stochastics are now overbought
- Key resistance looms in the 2.08-9 zone
GBP/NZD is our currency pair in play this week due to a number of high-impact economic reports out of the UK and New Zealand (see “Data Highlights” below for more). Last week, GBP/NZD rallied sharply from a low at the psychologically significant 2.00 level all the way up to a peak above 2.0800 on Friday. Not surprisingly, the MACD is showing strong momentum after such a strong rally, though the Slow Stochastics are now overbought. For this week, traders will watch to see if the pair can break key previous resistance in the 2.08-9 zone.
What Will EU Referendum Fears Mean for British Pound after UK Elections?
The shock election victory for the UK’s Conservative Party triggered a rally in UK asset classes on Friday; however, in the aftermath of the election questions are being asked about the future of the UK’s EU membership now that the Conservatives are firmly back in power.
Prime Minister David Cameron mentioned his pledge to hold an EU referendum before the Conservative majority had been confirmed and warnings from elsewhere about a potential referendum have started to come thick and fast. The UK’s banking body urged caution and stressed the need to ensure that the financial sector is protected if the UK leaves the EU. Credit rating agency Moody’s released a statement earlier and said that a referendum could have implications for the UK’s credit rating. Thus, just because the Conservatives have a majority in the UK and it is considered a “business-friendly” party does not mean that financial markets will stay sanguine with Cameron for the long term.
But are markets worrying for no reason? We think that they might be for a couple of reasons:
- If we do get a referendum in 2017, don’t automatically trust the opinion polls; they got it catastrophically wrong in this election and could do so again. People may say they want to leave the EU, but they might lose their nerve in the polling booth.
- This election saw the majority of the electorate (38%) vote for the status quo. Thus, at this juncture in UK’s economic recovery the electorate chose not to rock the boat and change leadership. The status quo bias could also determine the outcome of an EU referendum, as a large number of voters will not have lived through a time before the UK was part of Europe.
So what about the pound? After a shock election result, the market may need to rethink its view on the medium-term outlook for the pound. Below are our thoughts:
- The pound had a 250-pip bounce on the back of the UK exit polls, which predicted a Tory victory.
- This was a decent move, but does not suggest euphoria in the financial markets on the back of the Conservative win. The FX market may have held back due to EU referendum fears.
- Overall, domestic factors could play second fiddle for the pound, as the dollar and speculation about US interest rates are key drivers of the FX market this year.
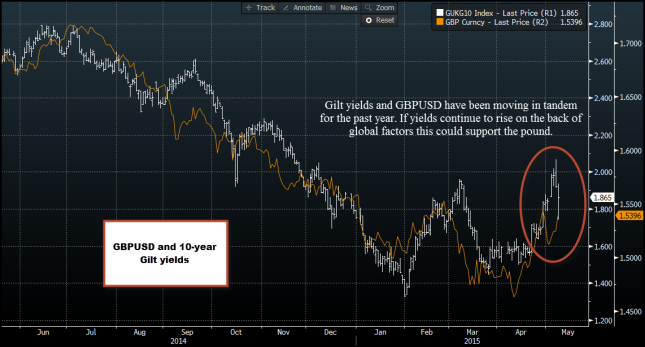
- Due to the above point, if UK yields continue to move higher on the back of global factors then this could support GBP going forward.
- We think that the failure to significantly break above 1.55 is significant, and suggests we could be range-bound in cable between 1.51-1.55 for the next few weeks.
- In contrast, the election result could have a longer-term impact on the stock market as fears about a potential Labour government raising taxes, hiking the bank levy, and limiting increases in utility prices has been eradicated. If this positive sentiment could be maintained then we could see fresh record highs back above 7,122 for the FTSE 100 in the coming weeks.
It is also worth noting the reaction in bond yields. UK 10-Year Gilt yields have actually fallen in the aftermath of the election result, in line with global yields which have also fallen back after some large increases in yields earlier this week. However, the decline in Gilt yields/ rise in Gilt prices could also be the market breathing a sigh of relief that political uncertainty in the UK has been eradicated for another five years.
Overall, in the short term the election result is positive for sterling, but in the longer term it could struggle to make gains towards 1.60 if the spectre of an EU referendum starts to loom large.
EUR: Is Greece Still a Concern?
As we start a new week we are only days away from another repayment deadline for Athens on Tuesday. After more negotiations last week, we are still no closer to Greece securing a bailout deal. However, there was some softening in the rhetoric, with EU officials still claiming that it is too early to talk about a Grexit. Also, the Greek fin min said that a deal is getting close. So what should we expect this week?
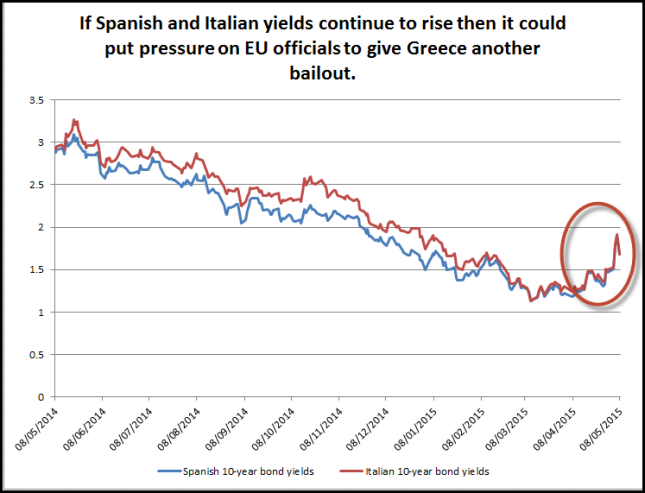
We think that the oil price could be the key determinant to whether or not Greece secures funds. This may not be as ridiculous as it sounds. Global bond yields rose last week as oil prices started to pick-up, which led to questions about inflation picking up later this year. The problem for EU officials is that Italian and Spanish bond yields also rose, which could trigger fears about another sovereign debt crisis. Thus, Europe may give in to Greek demands and offer another bailout to Athens in the view that this could reduce upward pressure on Europe’s peripheral bond yields. As we start a new week, if we continue to see upward pressure on Europe’s yields then this could lead to a quick solution for Greece’s current cash crunch.
The EUR has mostly ignored the plight of Athens as it tries to scrape together enough pennies to meet a tough repayment schedule. However, at the end of last week the sharp drop in EUR/GBP also weighed on EUR/USD, which got stuck at 1.1239. We need to break above 1.1392 to open the way to 1.15 and potentially to 1.20.
In our stock market report on Thursday we highlighted among other things the fact that the FTSE was under increased pressure because this UK general election was among the most unpredictable ones in history. The biggest risk for the FTSE and other UK assets in our view was if we got a hung parliament. We argued that even if this potential outcome had no economic impact, the uncertainty that came with it may well have undermined the appetite for risk. Therefore, as soon as it became apparent that this was not going to be the case, the UK markets staged a sharp relief rally. The FTSE 100 future spiked on Thursday evening and by early trading on Friday morning it was up a cool 150 points as the Conservatives’ majority victory was priced in, an outcome which has removed the threat of tighter restrictions that were proposed by the Labour party on several sectors of the economy. These included the energy sector; the housing market, with shares in homebuilders coming under pressure in recent times after Labour said it would introduce rent controls; gambling companies were undermined by the same party’s promise to give local councils powers to ban fixed-odds betting terminals and UK listed banks were held back on concerns about Labour’s plans on the excesses of the City. Shares in these sectors were thus expressing a big sigh of relief on Friday morning. Preventing an even bigger rally on Friday was the disappointing Chinese trade figures that were largely overshadowed by the UK election results. Exports in the world’s second largest economy fell by 6.4% year-over-year in April while imports contracted by 16.7%. Both figures were significantly worse than expected, which does not bode well for commodities with China being a major importer of iron ore and crude oil, among other basic materials. The news could weigh on shares of some mining and energy firms once the UK election euphoria fades next week.
Indeed, once the election jubilations are over, the domestic focus will turn to the challenges that lie ahead, including the possibility of Britain leaving the EU and Scottish Independence. These concerns may hold UK assets back over the longer term. Next week will be another busy one for the UK as far as the macro picture is concerned (see the Global Data Highlights section below). The main events include the latest jobs data and the Bank of England Inflation Report, both on Wednesday. The jobs data should provide a good clue about the health of the UK economy while the inflation report should give us a better idea about the timing of the first BoE rate hike.
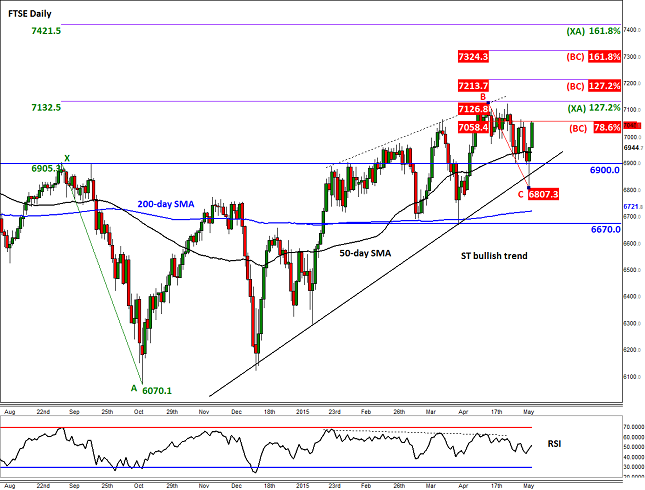
The FTSE actually managed to hold its own above the trend line we identified on Thursday, and the bulls have also defended the key 6900 level on a closing basis. The resulting rally has seen the index jump all the way to 7055, a level which has offered a bit of resistance for now. As well as the high from earlier in the week, this level corresponds with the 78.6% Fibonacci retracement of the downswing from the record high achieved last month. If broken, the next potential resistance areas to watch next week are the Fibonacci extension levels at 7130, 7215, 7325 and 7420, derived from the XA and BC swings as shown on the chart. Our near-term view on the FTSE will remain bullish for as long as the trend line holds as support. If broken then we wouldn’t rule out the possibility for a sharp drop towards the 200-day moving average at 6720 or the horizontal support further lower at 6670.
Crude Oil prices took a nosedive on Wednesday afternoon when the EIA published its latest supply data. Although this showed that crude stocks fell by a good 3.9 million barrels last week (which was the first decline since early January), oil prices were unable to advance any further than they already had. As well as for technical reasons (see below), speculators were happy to take advantage of the news to book profit as they had already expanded their bullish positions significantly in recent weeks. The reaction of oil prices suggests traders are probably not convinced yet that last week’s drop in crude stockpiles would mark the start of a major destocking cycle. After all, the decline was mainly due to a sharp fall in oil imports. But the refinery utilization rate has risen above the normal level for this time of the year which suggests that demand for oil is high and points to lower stockpile levels in the coming weeks. Indeed, the global demand for oil does appear to be stronger than had been expected, which is probably why Saudi Arabia recently hiked its prices to customers in Europe and North America. On top of this, the latest Chinese trade data shows that crude imports from the world’s second largest oil consumer hit a record level of 7.4 million barrels per day in April. This was significantly higher than the previous record achieved in December 2014. So, oil’s recent rally is not totally unjustified, but it probably got a little ahead of it itself and is now pausing for breath. The strong oil demand from China was probably reflected in the rallying prices of oil last month anyway, so it is not a major surprise why crude failed to respond to the data on Friday. Also weighing on the dollar-denominated crude oil this week was the rebounding greenback which found some support from a decent employment report. Next week’s key data for oil will be industrial production from China and the first quarter German and Eurozone GDP estimates, all due out on Wednesday. In fact, Wednesday will be an important day for oil traders as we will also have the usual weekly supply report to look forward to – will there be another sharp decrease in crude stocks?
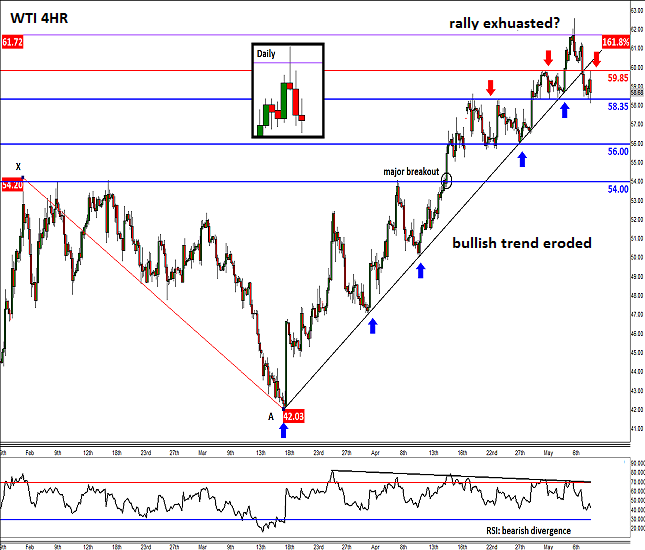
From a purely technical point of view, the crude oil rally looks to be over – at least in the near term anyway. Following the publication of the weekly inventories report on Wednesday, oil initially rallied before heading south. The resulting price action created a bearish-looking candlestick pattern on the daily chart, namely an inverted hammer (see the inset on the 4-hour chart, below). This formation is typically found at the top of upward trending markets and usually, but not always, signals major turning points. Given the technical importance of this candlestick formation, bullish oil speculators rushed for the exits on Thursday and early on Friday in order to protect the profits they had accumulated thus far in the year. In addition to the candlestick pattern, the chart shows that the rally has stalled around the 161.8% Fibonacci extension level of the last notable downswing we saw between February and March, around $61.70. In other words, the crude oil rally had already reached an exhaustion area. As a bullish trend line has now been broken, it will be interesting to observe what oil may do around $59.85, a support-turned-resistance level. For as long as the bears defend this level, the near term trend will remain bearish. So far however the sellers have only been able to push oil to as low as $58.35, a level which was formerly resistance. For oil to make a move towards the key support at $54.00, it will have to break decisively below $58.35 first. Additional support comes in at $56.00.
Monday, May 11, 2015
All Day Eurogroup Meeting
Greece. Lucky us, we get to start the week with Greek concerns as the never-ending drama continues to unfold. Greece says they will pay all their debts on time, but they likely need more funding from the rest of the EU in order to do it. As the issue continues to drag on, European nations are likely to get more frustrated which could lead to legitimate selling of the euro.
11:00 GMT Bank of England Interest Rate Decision
This event is one of those that we have to cover, but likely won’t amount to anything. The BoE hasn’t made a change in interest rates for a VERY long time, and they likely won’t this time around either. Nevertheless, it would be haphazard to ignore a central bank meeting (see Switzerland for a recent example).
Tuesday, May 12, 2015
No major events scheduled.
Wednesday, May 13, 2015
1:30 GMT Australian Wage Price Index (Q1)
This is an inflationary measurement from the consumer side of the equation which measures the cost of labor. The general theory is that if wages are rising, prices of goods will do the same, which is a healthy development in this inflation-starved global environment we occupy. Overall, this figure has been pretty consistent over the last few years, but if it were to fall below the 0.6% expected, the Reserve Bank of Australia may have to contemplate cutting rates even further.
5:30 GMT Chinese Industrial Production and Retail Sales (April)
China is notorious for dropping a bunch of data all at the same time, so there will be even more to ponder over than just these two releases, however, they are the most vital. China has been struggling in almost every aspect of their economy lately, so declines or missed expectations could have even more effect than usual. If they improve though, there could be a relief rally in both AUD and NZD as a consequence.
6:00 GMT German Preliminary Gross Domestic Product (Q1)
Being the largest member of the Eurozone, Germany has an oversized influence on growth in the region. Despite the rest of the EZ struggling to find some economic traction, German growth hasn’t wavered too much, and has generally been stronger than anticipated. Expectations are entrenched around 0.5%, but if the US GDP miss is any indication of global demand during Q1, that hill may be difficult to climb.
8:30 GMT UK Claimant Count Change (April)
Employment figures in any nation are always an important measure of strength in the economy, and the UK is no different. Last month’s miss reversed a string of four straight strong surprises, and consensus for this month has come down to accommodate. As the US employment figure showed, sometimes a bad number is offset with a rebound the next month, which means that expectations could be a little low, opening up the possibility for a return to surprise beats.
9:30 GMT Bank of England Quarterly Inflation Report and Governor Mark Carney’s Speech
The QIR is always a market moving event for the GBP, particularly now that inflation has become such a hot topic around the globe. The BoE’s expectations for inflation moving forward shapes their monetary policy, and if they are more optimistic than they have been of late, the GBP may benefit in folds.
12:30 GMT US Retail Sales (April)
If there is one report that simply refuses to go along with the story of a US-led global recovery it is this one. Previous to last month’s 0.9% increase, Retail Sales had declined for three straight months. Still last month’s decent figure was obscured by the fact that it failed to live up to expectations of 1.1%. This time around, consensus is low, at 0.3%, so the hurdle may be easy to clear.
22:45 GMT New Zealand’s Retail Sales (Q1)
Instead of measuring sales on a monthly basis like the rest of the world, New Zealand likes to do things on a quarterly basis. That arrangement has a dual effect of making this report more predictable, but also increases the severity of movement if those predictions are wrong. Consensus is expecting a 1.6% increase, which would put it right in line with what it has been over the last three releases. Considering the struggles in dairy prices, though, a miss on this figure wouldn’t be out of the question.
Thursday, May 14, 2015
12:30 GMT US Producer Price Index (April)
Typically, PPI wouldn’t be a major event, but due to all the concern over inflation lately, it has taken on a little more importance. Improvements here could bolster the argument for the Federal Reserve to raise interest rates sooner rather than later, but there hasn’t been a better-than-consensus result in this metric since the November 2014 release. Expectations are low at 0.1%, so even measuring up to last month’s 0.2% read would be a welcome signal that transitory effects may be waning.
Friday, May 15, 2015
3:40 GMT Bank of Japan Governor Haruhiko Kuroda’s Speech
Consumers in Japan still aren’t spending like officials would like after the sales tax increase last year despite the increased monetary stimulus from the BoJ. Previous actions from the BoJ would seem to indicate that they will add to their Quantitative and Qualitative Easing program to get the process started, but recent comments from Prime Minister Shinzo Abe’s cabinet members dispel that theory. We may get the answers from Kuroda in this speech, and if he signals that more QQE is on the way, the JPY crosses could see a substantial jump.
14:00 GMT University of Michigan Preliminary Consumer Sentiment Index (May)
By and large the US consumer has been feeling pretty good lately. Employment has been strong, for the most part, gas prices are low, and the housing market is finally starting to see some consistent strength. Out of the last eight UM Consumer Sentiment releases, only two have failed to live up to expectations, and consensus isn’t anticipating anything too crazy this time around. A mild increase from the previous figure is all the market expects, and if the current trend prevails, it may be an easy victory for the USD.
