Technical Developments to Watch:
- EUR/USD testing support in the 1.0850-80 zone
- GBP/USD back above its 20-day EMA on rate hike expectations
- USD/JPY bias has turned back higher as safe haven demand fades
- NZD/USD in play, at a new 5-year low ahead of key RBNZ meeting
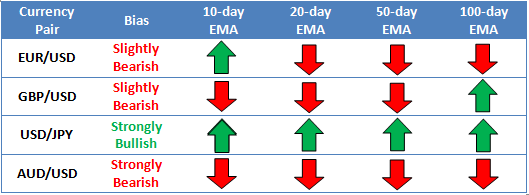
Source: FOREX.com
* Bias determined by the relationship between price and various EMAs. The following system determines bias (numbers represent how many EMAs the price closed the week above): 0 = Strongly Bearish, 1 = Slightly Bearish, 2 = Neutral, 3 = Slightly Bullish, 4 = Strongly Bullish.
** All data and comments in this report as of Friday afternoon **
EUR/USD

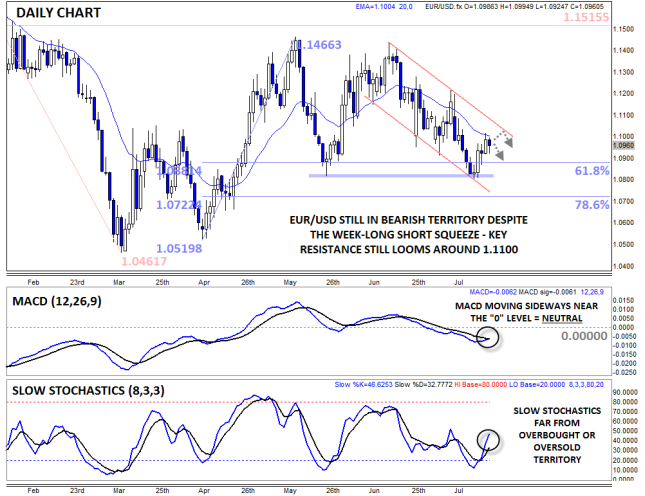
- EUR/USD rallied in consistent short squeeze off 1.0800 support last week
- The Slow Stochastics have now bounced out off oversold territory
- Medium-term downtrend remains intact below resistance around 1.1100
EUR/USD rallied consistently throughout last week in a prolonged short squeeze off previous support at the 1.0800 level last week. Not surprisingly, this big rally has taken the Slow Stochastics back out of oversold territory, though the MACD still remains below the “0” level, signaling generally bearish momentum. Despite last week’s big rally, the medium-term downtrend is still intact below 1.1100 and traders may look to last week’s rally beneath that resistance zone.
Source: FOREX.com
GBP/USD

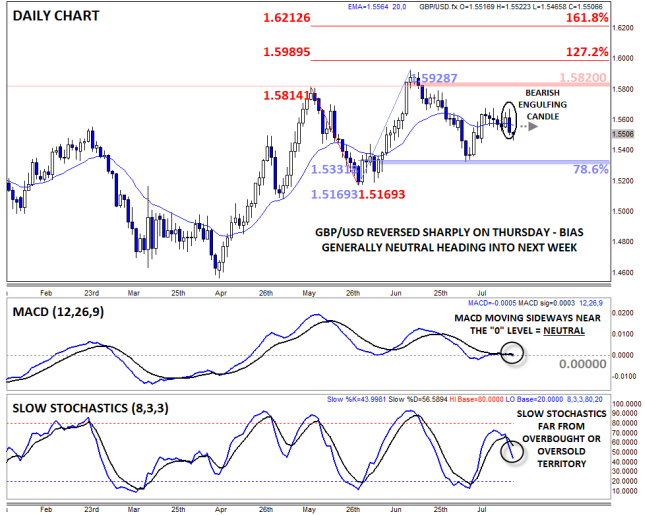
- GBP/USD reversed sharply back to the downside on Thursday
- MACD and Slow Stochastics show balanced, two-way trade
- Key near-term resistance still looms at 1.5675
GBP/USD looked to be breaking out on Wednesday before sellers stepped in aggressively to push the pair back lower on Thursday, creating a large daily Bearish Engulfing Candle* in the process. With both the MACD and Slow Stochastics in neutral territory, traders may opt to adopt a neutral bias heading into the new trading week and react to the price action and news announcements as they come.
* A Bearish Engulfing candle is formed when the candle breaks above the high of the previous time period before sellers step in and push rates down to close below the low of the previous time period. It indicates that the sellers have wrested control of the market from the buyers.
Source: FOREX.com
USD/JPY

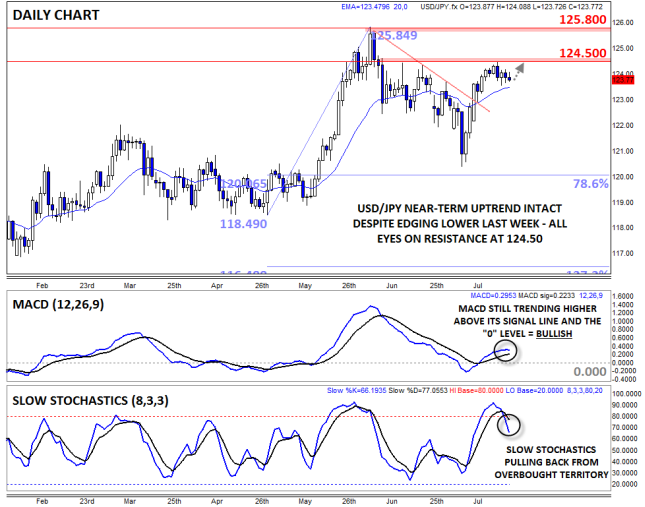
- USD/JPY edged lower from previous resistance at 124.50 last week
- MACD still shows bullish momentum, Slow Stochastics no longer overbought
- The bias remains cautiously bullish now that the overbought conditions has receded
USD/JPY edged lower last week, pulling back from previous resistance at the 124.50 level last week. The pullback is not surprising, given the lack of bullish-dollar or bearish yen catalysts, and the pair’s previous overbought reading in the Slow Stochastics has now evaporated. For this week, we maintain a cautiously bullish bias, with a breakout above 124.50, if seen, potentially clearing the way for a continuation up to 125.80 next.
Source: FOREX.com

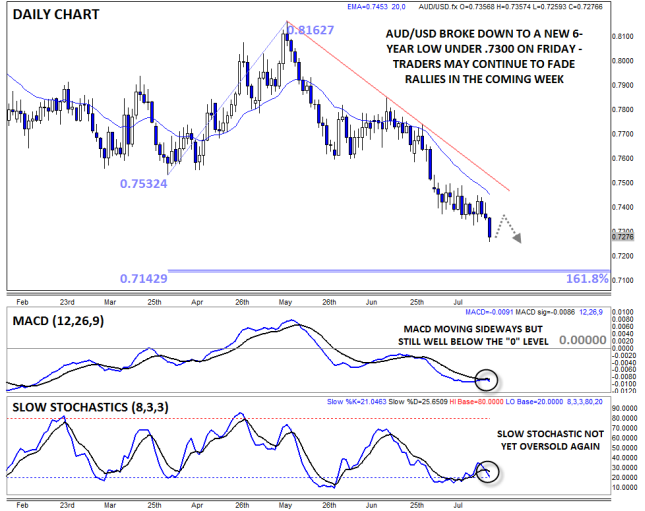
- AUD/USD broke down to a new 6-year low under .7300 on Friday
- Slow Stochastics not yet oversold
- Strong bearish trend remains intact – traders may continue to fade short-term rallies
AUD/USD is our currency pair in play this week due to a number of high-impact economic reports out of the Australia and the US in the coming week (see “Data Highlights” below for more). AUD/USD consolidated around .7400 for the first four days of last week before breaking down to a new 6-year low under .7300 on Friday, propelled by a weak Chinese Manufacturing PMI report. With the Slow Stochastics not yet oversold, traders may look to fade any near-term rallies in favor of the longer-term downtrend.
Source: FOREX.com
NZD/USD is Looking Like a Tasty Meal for Fed Hawks
The Reserve Bank of New Zealand (RBNZ) is one of the most dovish major central banks in the world in contrast to the Fed, which is probably the most hawkish central bank in the developed world. This is obviously a major problem for NZDUSD that has been in a broad downward trend since mid-2014, which was a turning point for both the Fed and RBNZ. At the time, the Fed was becoming more and more hawkish as US economic data improved, while the RBNZ’s rate-tightening cycle had just ended and it was turning more dovish by the month while at the same time verbally assaulting an “unjustified and unsustainable” NZ dollar.
Since then the RBNZ has unwound some of last year’s policy tightening with two consecutive 25bps cuts to the official cash rate (OCR) in June and July, and the Fed has been setting the stage for a potential rate hike later this year. Yet, there’s a chance the market has underestimated the likelihood that the Fed will raise interest rates at its September meeting, and it may use this week’s meeting (a policy statement is due at 1800GMT on Wednesday) to prepare the market for such an event.
During a recent speech Feb Chair Yellen seemed to be a little more hawkish than the market; a view supported by a general improvement in the economic outlook for the US. The economy is adding jobs at a healthy rate and core inflation is gaining pace (CPI excluding food and energy rose 1.8% y/y in June). Overall, we think the time is right for the Fed to prepare the market for the increased possibility of tighter monetary policy as soon as September.
This is in complete contrast to the situation in NZ where the RBNZ is expected to lob another 25bps off the OCR in September. The bank has already cut interest rates at its last two meetings and noted at its policy meeting last week that further policy easing seemed likely. In fact, there is the distinct possibility that the RBNZ will lower the OCR to 2.5% this year from 3.00% currently, unwinding the entirety of the bank’s tightening cycle in 1H 2014 and pushing the cash rate back to a record low.
What does this mean for NZD/USD?
With the market returning its focus to yield differentials as the threat of a Grexit in the near-term dissipates, a currency pairing underpinned by a clear divergence of monetary policies is going to be tasty option for bears. If the FOMC meeting this week paves the way for a rate hike at the Fed’s next policy meeting in September, which is when we are expecting the RBNZ to loosen monetary policy, NZD/USD would be a relative safe option for US dollar bulls, especially given a recent collapse in dairy prices.
It’s worth noting that the kiwi rallied on the back of the RBNZ’s decision to cut interest rates last week, but this only appears to be a temporary relief rally from investors that were expecting the bank to be even more dovish, thus we don’t expect it to last. NZD/USD remains in a long-term downward trend and may finally break support around 0.6500, assuming the FOMC complies. On the upside, we’re eyeing the top of the pair’s long-term down channel, a break of which would negate our bearish technical view.
Look Ahead: Stocks
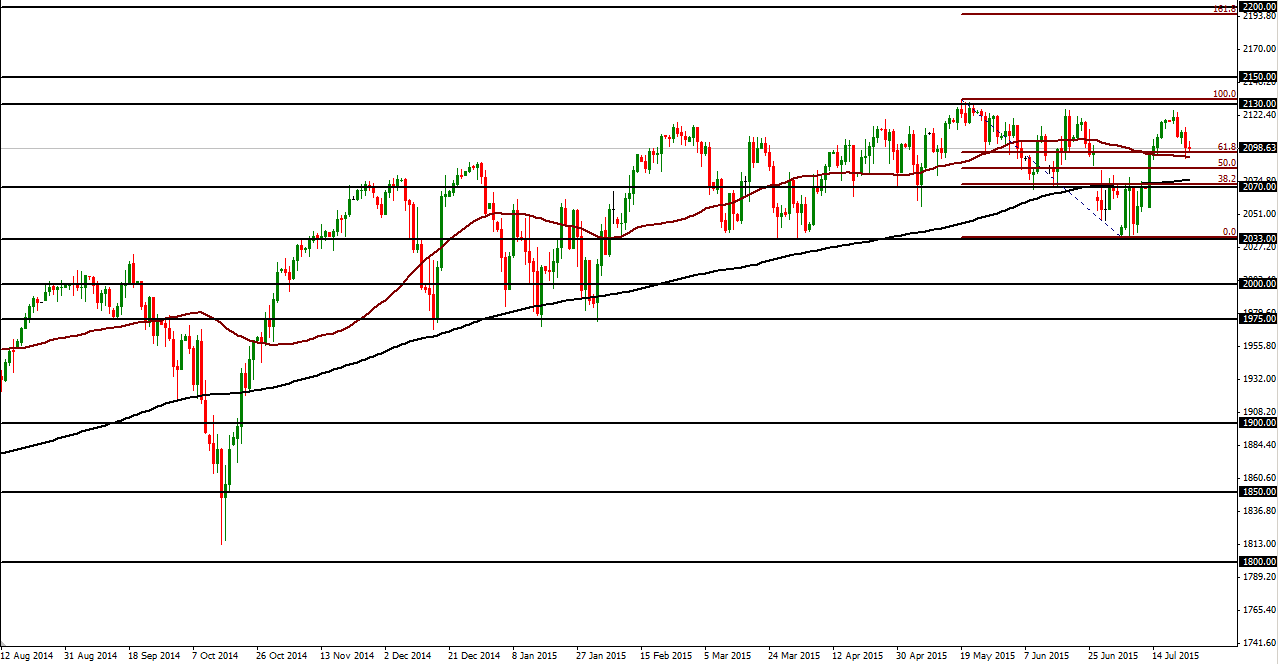
The S&P 500 peaked this past week around the 2125 level, just under May’s all-time high of 2134, before retreating significantly due partly to some major missed earnings releases in the US. Prior to this drop, the index had been climbing sharply in mid-July from its previous base around the 2035 level, which was a key support level that was last tested during dips in March and April. That climb was prompted by optimism over a potential resolution to the Greek debt crisis, a relative stabilization of China’s turbulent equity markets, and then a positive start to US earnings season. The resulting rebound pushed the index swiftly back above both its 200-day and 50-day moving averages once again. The subsequent retreat, however, has prompted a return back down to the 50-day average. Despite recent positive economic reports out of the US, including brisk home sales and low unemployment claims, the S&P 500 continues to be under the sway of major company earnings for the time being. Within this context, there is substantial risk of a further pullback, especially if the index finds its way below the 200-day moving average and the key 2070 level. In this event, major downside support remains around July’s lows at the noted 2035 level. While this pullback could well occur, the S&P 500 continues to trade within a long-term bullish trend going back more than six years, and could continue this longstanding uptrend after the current pullback. The clear upside target in this event is at the noted 2134 record high. From a longer-term technical perspective, any further move above that high, in uncharted territory, could begin to target further upside around the 2200 level, which is around the 161.8% Fibonacci extension of the most recent major pullback from the all-time high down to the 2035-area base.
Source: FOREX.com. Please note this product is not available to US clients
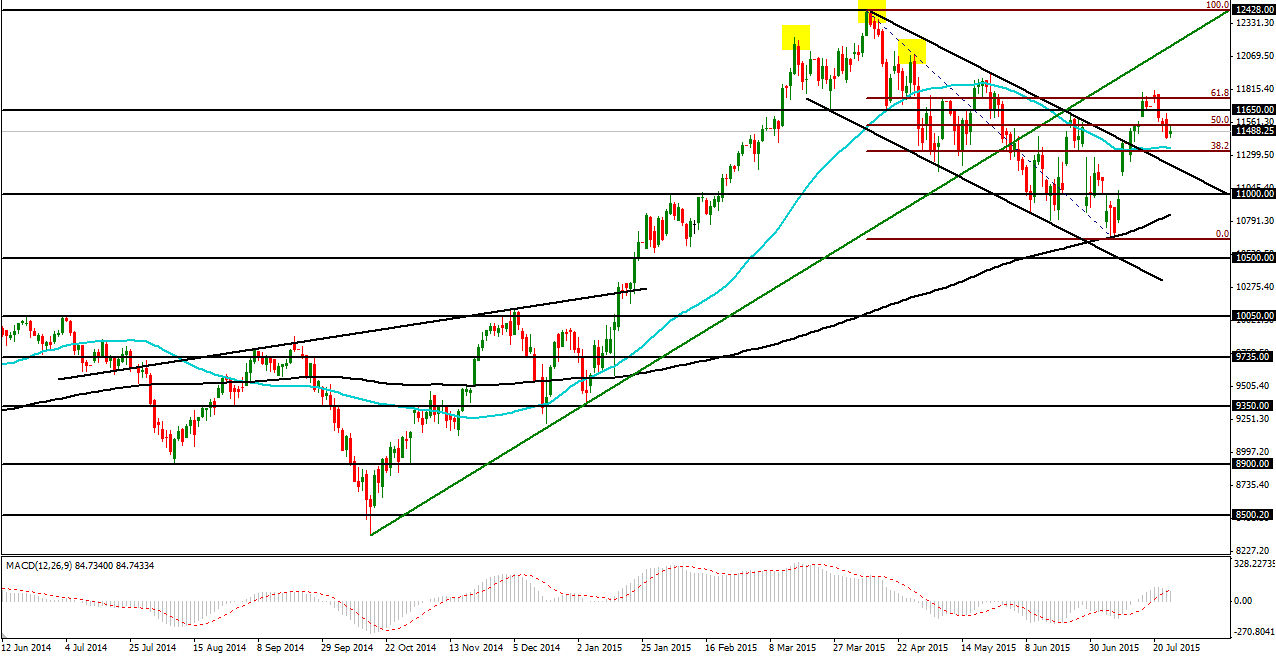
The German DAX index has also retreated after topping out in mid-July around 11805. This tentative top was also around the 61.8% Fibonacci retracement of the recent 14% correction from April’s all-time high around 12390 down to July’s low point around 10650, which was right around the key 200-day moving average. That downside correction was framed by a large descending trend channel that was broken out of in mid-July as optimism grew over a potential Greek bailout deal, leading to the recent July high. With any further downside momentum on the current retreat that pressures the index below its 50-day moving average, price action could move back into the previous descending trend channel targeting the 11000 psychological support level once again. The 200-day moving average should also provide support on any further decline. From a longer-term perspective, the longstanding trend continues to point to the upside. On any move back above the 11650 resistance level, upside targets remain around 11800 and the 12000 psychological level. Any further strengthening on a longer-term basis could then reach for a re-test of the noted 12390 high.
Source: FOREX.com. Please note this product is not available to US clients
Look Ahead: Commodities
WTI
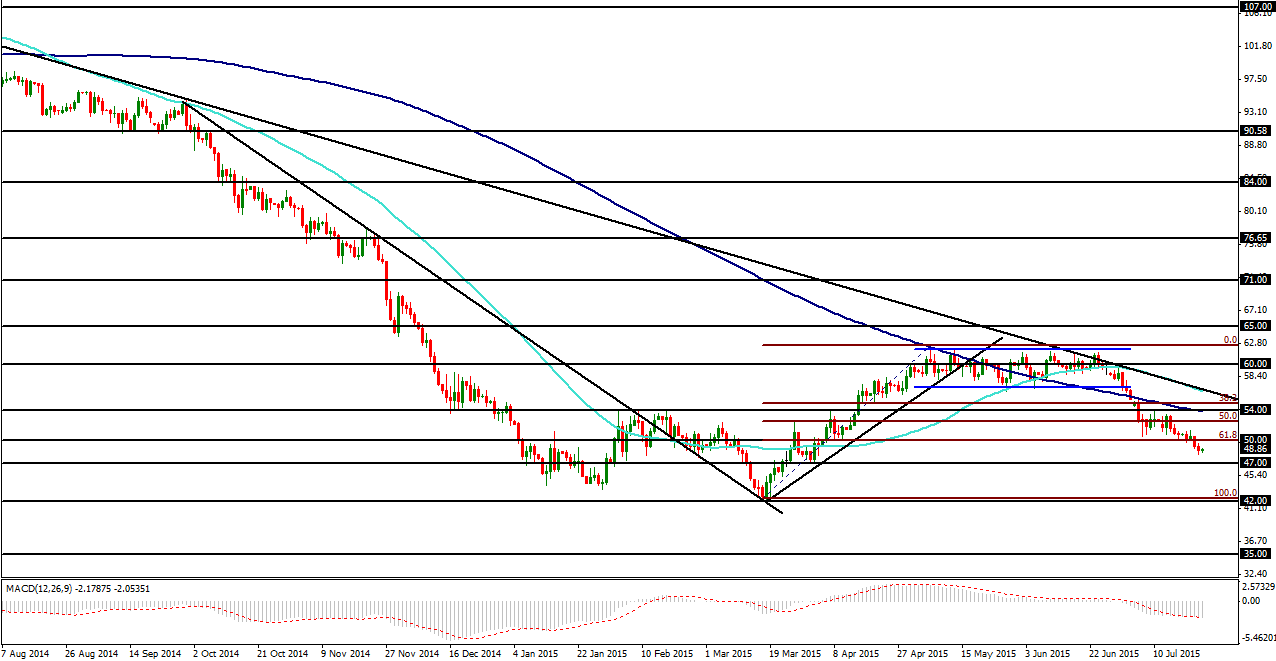
Crude oil continues to be pressured on persistent oversupply concerns and worries over sustained levels of demand. Both crude oil benchmarks, Brent and West Texas Intermediate (WTI), have fallen precipitously from last year’s highs. After rising from a six-year low around 42.00 in March, WTI entered into a prolonged trading range in May, with fluctuations above and below the 60.00 level. This range-bound price action was broken to the downside in early July, after which the price of oil continued to plunge below both the 200-day moving average as well as the key 54.00 support level to approach the 50.00 psychological support level. This 50.00 level was also at the 61.8% Fibonacci retracement of the rebound from March’s 42.00-area low to May’s year-to-date high around 62.50. After two weeks of consolidating just above 50.00, where it formed a bearish flag pattern, WTI broke down below this major support level, potentially on its way towards further support around 47.00. With further downside momentum on this breakdown and a move below 47.00, WTI could then begin to target a potential re-test of the 42.00-area multi-year low. Any breakout back above 50.00 should be limited to the upside by the major 54.00 resistance level.
Source: FOREX.com. Please note this product is not available to US clients
Global Data Highlights
Monday, July 27
0800GMT – German IFO Business Climate (July)
In June this closely watched index highlighting business climate in the heart of the Eurozone dropped significantly more than expected to 107.4 from 108.5 in the prior month. While this data was largely ignored by investors focused on Greece, last month’s decline was the second month in a row the index fell and another soft print could weigh on investor sentiment – the market is expecting a slight increase in July to 107.5.
1230GMT – US Durable Goods Orders (June)
Durable goods orders are expected to have increased 3.0% last month, after falling a revised 2.2% in the prior month. Core durable goods orders are expected to jump 0.4% over the same period as the market evaluates whether manufacturing orders are rebounding, which is an important gauge for the health of the all-important US manufacturing sector.
Tuesday, July 28
0830GMT – UK Preliminary GDP (Q2)
The UK’s Q1 growth numbers were revised higher in June and the market and the BOE have been on a high ever since, which makes these figures very important for investor sentiment and the future of monetary policy in Britain. The market is expecting the economy to have expanded an impressive 0.7% q/q last quarter, although year-on-year growth is anticipated to slow to 2.6% from a revised 2.9% in Q1.
Wednesday, July 29
1800GMT – FOMC Statement
The market isn’t expecting the Fed to move interest rates this month, but some hawkish comments from Fed Chair Yellen, encouraging US economic data and a calming of conditions in Europe and China has increased the possibility of a September rate hike. The FOMC may use this meeting to pave the way for a rate hike at its next meeting, which would likely result in a significant drive towards the US dollar. If it doesn’t, the US dollar may slide in the immediate aftermath of the meeting.
Thursday, July 30
1200GMT – German CPI (July)
The pace of inflation in the heart of the Eurozone is very important to overall investor sentiment, especially after headline CPI dropped 0.1% last month in Germany. The market is expecting headline CPI to have rebounded this month by 0.2% m/m and 0.3% y/y; a softer than expected print could do some damage to the euro.
1230GMT – US Advance GDP (Q2)
The US economy is expected to have rebounded in Q2 after faltering in the first three months of the year. Annualized GDP is expected to jump to 2.5% q/q, with consumer spending anticipated to have increased 2.7%. The pace of growth of the US economy is a major factor in the setting of monetary policy, thus it’s very closely watched by policy makers and investors.
2300GMT – Japan CPI (June)
Japanese core-CPI remains well below the Bank of Japan’s official 2% target and we are expecting the pace of core inflation to completely stall in June, after a measly 0.1% y/y increase in the prior month. If consumer prices drop back into deflationary territory it would greatly increase the likelihood of further policy loosening from the BoJ which is generally a yen negative and stock positive.
Friday, July 31
0900GMT – Eurozone CPI estimate (July)
Overall inflation within the Eurozone is expected to remain steady at 0.2% y/y this month, although if we see softer/stronger than expected CPI numbers from Germany it could see this estimate change down/up accordingly. Signs of inflation recently within the Eurozone have raised hopes for the longevity of the region, thus the market will be watching these numbers closely to see if its faith is warranted.
1230GMT – Canada GDP (May)
Surprisingly soft growth in Canada earlier in the year was largely responsible for the Bank of Canada’s decision to cut its benchmark overnight interest rate by 25bps earlier in the month. Canada is dangerously close to officially being in a recession, after GDP slummed 0.6% on an annualized basis last quarter and is expected to have shrunk again in Q2. During May the market expects the Canadian economy will emerge from four consecutive months of negative growth, but only just at 0.0% m/m.
