Technical Developments to Watch:
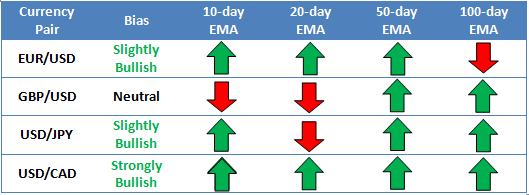
* Bias determined by the relationship between price and various EMAs. The following system determines bias (numbers represent how many EMAs the price closed the week above): 0 = Strongly Bearish, 1 = Slightly Bearish, 2 = Neutral, 3 = Slightly Bullish, 4 = Strongly Bullish.
** All data and comments in this report as of Friday afternoon **
EUR/USD

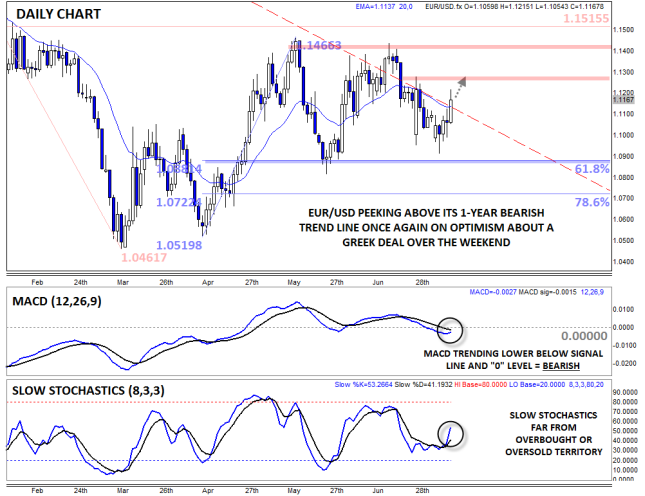
- EUR/USD spiked higher on Friday on optimism about a possible bailout deal
- MACD relatively neutral, Slow Stochastics far from overbought or oversold
- Potential for a more substantial rally if Greek deal reached this weekend
Last week was a nail-biter for EUR/USD bulls and bears, but as we head into the weekend, the market seems optimistic that a Greek bailout deal will be reached. Athens’ latest proposal included concessions in a number of key areas, and with public sentiment still strongly in favor of keeping Greece in the Eurozone, we’re cautiously optimistic on the prospects for a deal. From a technical perspective, the pair is peeking back out above resistance at its one-year bearish trend line and the 20-day EMA, potentially opening the door for a more substantial rally. To the topside, the next level of resistance is the three-week high at 1.1280, followed by the previous peaks above 1.1400. To the downside, support starts to emerge in the mid-1.09s.
Source: FOREX.com
GBP/USD

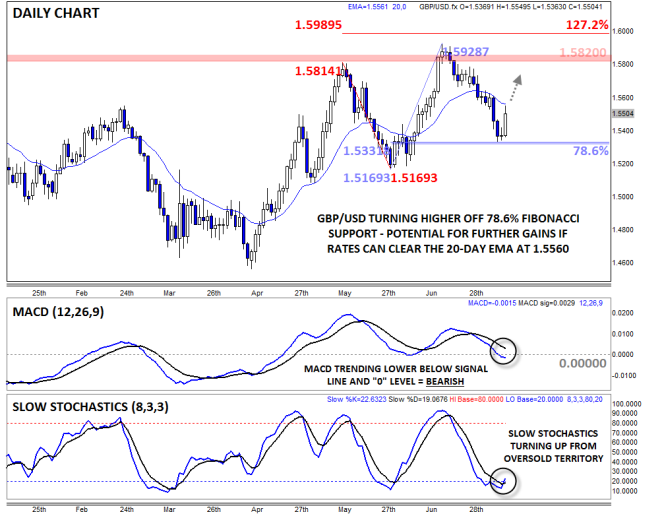
- GBP/USD sold off early last week before the bulls came storming back on Friday
- Slow Stochastics turning higher from oversold territory
- The 20-day EMA near 1.5565 will be a key level to watch this week
GBP/USD dropped along with its mainland European rival on concerns about Greece early last week, but hope over a breakthrough Greek deal propelled the pound higher on Friday as well. As we go to press, the pair is trading near the weekly open, and with the Slow Stochastics turning higher from oversold territory, a more substantial bounce is possible moving into the coming week. For now, all eyes are on the 20-day EMA around 1.5565, with a break above that level potentially signaling a continuation toward 1.5700 or 1.5800 this week.
Source: FOREX.com
USD/JPY

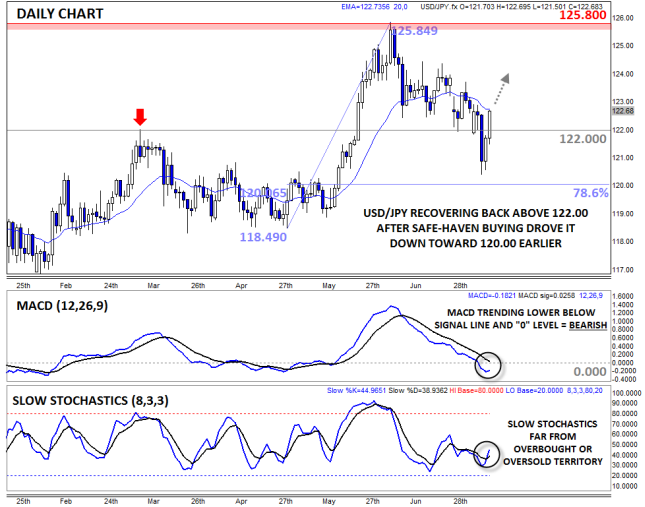
- USD/JPY dipped on safe haven demand early last week, but recovered on Thursday/Friday
- MACD still signaling bearish momentum
- The move back above 122.00 suggests that we could see more strength this week
USD/JPY dropped to a new six-week low on safe-haven demand for the yen last week, but that move faded by the end of the week, with rates recovering back to the 20-day EMA at 122.75. Though the MACD is still trending lower beneath its signal line and the “0” level, showing bearish momentum, there is a bullish divergence in the Slow Stochastics indicator, suggesting that we may have seen a meaningful bottom last week. As long as rates remain above the 122.00 level, the bulls will be in control for a potential continuation higher this week.
Source: FOREX.com
USD/CAD

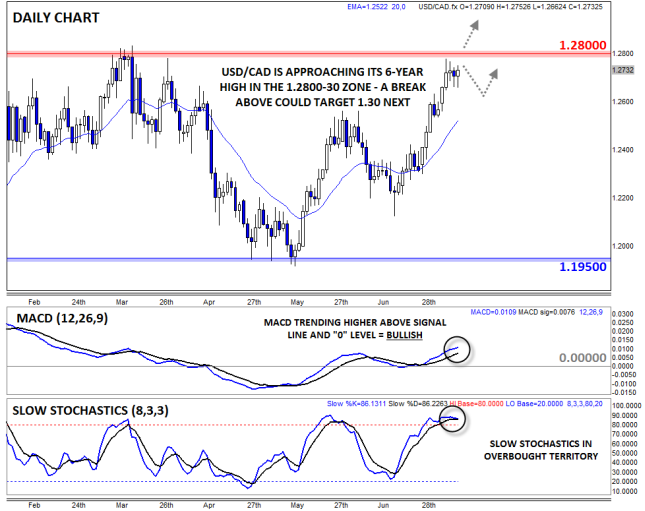
- USD/CAD rallied toward its 6-year high at 1.2800 last week
- MACD shows strongly bullish momentum, but Slow Stochastics now overbought
- Bulls will remain cautious beneath the 1.2800 level, but a break above could expose 1.30
USD/CAD is our currency pair in play this week due to a number of high-impact economic reports out of the US and Canada in the coming week (see “Data Highlights” below for more). Last week, USD/CAD rallied toward its six-year high in the 1.2800-30 zone, but as we go to press, remains below that key resistance zone. Not surprisingly, the MACD indicator is showing bullish momentum, though the overbought Slow Stochastics suggests bulls may have difficulty overcoming the major resistance barrier this week. If we do see a breakout above 1.2830, a continuation toward the 11-year high at 1.30 may be next.
Source: FOREX.com
What’s Next for Chinese Shares?
Shanghai stocks have jumped at the fastest pace for seven years in the last two days, so where will Chinese markets go next?
To answer this question we need to look at it from a few angles:
1. Volatility:
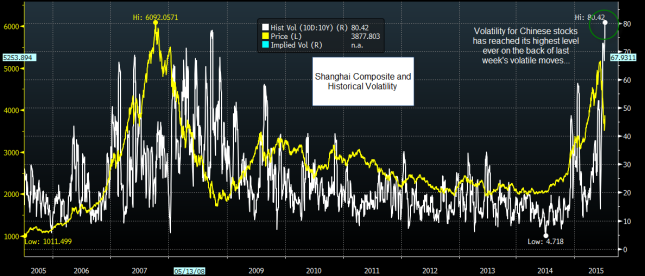
We noted last week that the Chinese index was due a rebound because volatility had spiked to one of its highest ever levels. Typically, when volatility spikes, it can mark the bottom of the market and we can see shares rise and volatility start to moderate during the following trading sessions. However, in another sign that China walks to the beat of its own drum, Chinese shares have rallied some 15% in the last two sessions, yet volatility has surged to a record high above 80. This is to be expected; after all, a 15% move in two days is extremely volatile, whatever the direction. But with volatility remaining at this high level we think prices could be extremely choppy in the coming week with prices swinging from sharp lows to sharp highs almost overnight. Thus, we don’t think that the price action of the last couple of days means that Chinese stocks are out of the woods yet, and they could still suffer some sharp sell offs.
Source: FOREX.com, Data: Bloomberg
2. China ignores external fears:
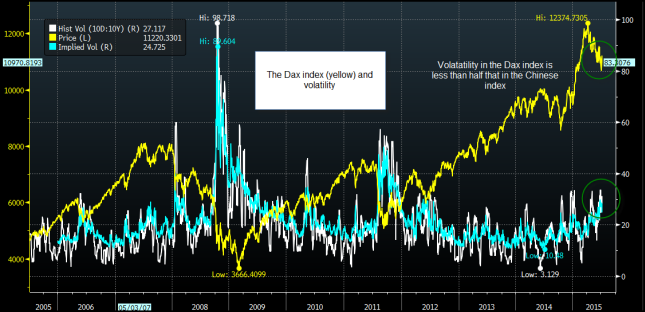
The investment community may be focused on Greece, however, do not expect China to celebrate if Greece seals a deal with its creditors. As you can see in figure 2, volatility in the German DAX is less than half that in the Shanghai index. China doesn’t move in the same way as other indices and may not react to the Greek crisis, instead focusing on domestic issues in the days ahead.
Source: FOREX.com, Data: Bloomberg
3. China’s version of QE
In recent weeks China has shown its willingness to help support its tumbling stock market. Chinese authorities cut borrowing rates, it banned large shareholders from selling their positions and a Chinese state investment vehicle has been tasked with buying shares (although these shares do not lie on the PBOC balance sheet). With nearly half of all companies listed on the Shanghai Composite still not trading after being suspended last week, the government intervention has seriously distorted price action.
Some expect even more supportive action to come from the Chinese central bank, including another large interest rate cut (China last cut rates at the end of June, when they were cut by 25 bps to 4.85%), which could see China join the zero-rate club in the coming months and years. If this happens then it could boost the attractiveness of the Chinese stock market and see an extension of the recovery that we have seen in recent days.
This week’s critical economic data (see below), could hasten further action to support the stock market by the central bank, particularly if the economic data surprises to the downside.
4. Economic data
This week’s critical release will be Chinese Q2 GDP, which is released on 15th July. The market is expecting GDP to fall to 6.8% from 7%. If we see a sharper-than-expected decline, say 6.5% or below, then we could see panic set in about China’s future economic prospects, and more selling in the Shanghai Composite. However, this would also be the time when we would expect to see the Chinese authorities intervene with more stimulus measures. Thus, if we do get weak economic data in the coming days, expect another volatile period for Chinese stocks.
Takeaway:
As you can see, the outlook for Chinese stocks is not clear cut, and there are as many reasons for stocks to fall as there are for them to recover. However, if Chinese markets are to embark on another uptrend, it may require even more state support, so watch out for the PBOC and a further rate cut. This is important for markets outside of China including the ASX in Australia, the Hang Seng, the Nikkei and commodities.
Greek Risks for the Next Two Weeks
The clock is ticking for Greece to reach an agreement with its creditors to avoid further default and potential exit from the Eurozone. The deadline for a decision to be made is now Monday. Amidst all of this confusion we have boiled down the crisis to its most important parts, and tried to determine how this could impact markets in early part of this week.
Key dates in the coming days/ weeks:
- 12th July: Another EU summit is convened and billed as the last chance for both sides to reach an agreement.
- 20th July: Greece owes the ECB EUR 3.5bn, if it fails to pay this then it may be cut off from vital ECB funds, causing the collapse of the Greek banking system.
Pre 12th July summit:
- Although Greece voted no to more bailout reforms on July 5th, its government has backtracked and brought a new program of reforms to its creditors.
- Some members of the Syriza party are angry about this.
- Germany says that any new bailout would be on a “completely new basis, under toughened economic preconditions”.
- So…opposition from both sides ahead of 12th July summit.
Potential outcome from the 12th July summit:
1. Greece agrees to a deal with its creditors for approx. EUR 50 bn in new bailout funds.
- This would make it more likely that Greece can pay the ECB its EUR 3.5bn bond, thus its banks may still be able to receive ELA funding and avoid financial catastrophe.
- This is the only outcome at this stage that can keep Greece in the currency bloc.
Problems with this “good” outcome:
Greek problems:
- Members of the Syriza party are angry about these negotiations as they include more austerity. There will be a parliamentary debate about whether to accept new austerity terms at 5pm (London) on Friday.
- If the Greek parliament votes against the government then it could be game over, and we doubt that the EU summit would agree to give more funds to Greece (point 2 kicks in).
German problems:
- Prior to the 5th July referendum, the German fin min said that any new deal for Greece would have to be approved by the Bundestag. This still holds, we don’t know how long this would take to get through the German Parliament, the Bundestag has passed bailouts for Greece before, but will they be happy to pledge more of German taxpayer money to Greece? Maybe not, if Greece demands debt restructuring. Again, if Germany vetoes a bailout for Greece then it could be game over.
Market reaction: Even if a deal is reached, the Germans or Greeks could scupper things, so we may only see a muted reaction in risky assets.
2. No deal is reached:
This is the worst possible outcome that would ultimately lead to Greece defaulting on 20th July, its banks being stripped of ELA funding, the collapse of the financial sector, and ultimately a Grexit.
Market Reaction: This could trigger a sharp selloff in risky assets. Friday saw EUR-based assets price in a positive outcome for Sunday, with stocks up some 3%. We would expect prices to reverse Friday’s gains and then some.
3. The can gets kicked down the road:
If no deal is reached then the two sides could re-schedule for the middle of next week, however the clock is ticking for Greece to pay back the ECB on 20th July.
Market reaction: EUR could fall back – but any selloff would likely be limited as we wait for the next round of negotiations.
Overall: All efforts should now be focused on Greece meeting its 20th July repayment deadline.
Look Ahead: Stocks
Hopefully by early next week investors will be allowed to concentrate on the actual fundamentals that drive the market because a bailout agreement for Greece looks imminent now. If seen, investors could move back into riskier assets such as equities. In fact, there were tentative signs of this happening at end of this current week as the indices have found some apparent buying interest, so things may already be in motion. That being said, it remains to be seen whether a deal for Greece will inspire a sustained rally. Indeed, it is not just the crisis in Greece which has weighed on risk sentiment recently. The stock market turmoil in China, the dollar’s strength and concerns about a premature lift off of rates in the US have been among the other factors. With regards to China, although the Shanghai Composite managed to make back a big chunk of the losses suffered earlier in the week, the situation there remains quite uncertain and things could go from bad to worse if the upcoming data releases from the world’s second largest economy disappoints expectations.
In the US, investors are probably waiting to see the results of some company earnings before deciding on what to do with their long equity holdings. The second quarter reporting season has already started and will kick into a higher gear next week. The key earnings for next week are as follows:
- Tuesday 14 July: Johnson & Johnson (NYSE:JNJ), JPMorgan Chase & Co (NYSE:JPM), Wells Fargo & Company (NYSE:WFC), Yum! Brands Inc (NYSE:YUM)
- Wednesday 15 July: Delta Air Lines (NYSE:DAL), U.S. Bancorp (SA:USBC34), BlackRock Inc (NYSE:BLK), Bank of America Corporation (NYSE:BAC), Intel (NASDAQ:INTC), Netflix (NASDAQ:NFLX)
- Thursday 16 July: Charles Schwab (NYSE:SCHW), eBay Inc (NASDAQ:EBAY), Goldman Sachs Group Inc (NYSE:GS), Blackstone (NYSE:BX), Domino`s Pizza Group Plc (ASX:DMP), Citigroup (NYSE:C), Advanced Micro Devices Inc (NASDAQ:AMD), Google (NASDAQ:GOOGL)
- Friday 17 July 15: Honeywell International Inc (NYSE:HON), General Electric Company (NYSE:GE)
With regards to earnings, a lot has rightly been said about the impact of the stronger dollar hurting the bottom line. We will soon find out if this was indeed the case in the second quarter and if so what the damage was. As well as safe haven demand, the dollar has been supported by expectations about the Federal Reserve becoming the first major central bank to hike interest rates. Not a long time ago, the Fed was expected to start raising rates in June. Then expectations were pushed out slightly for a September hike and then to December. But now the calls are growing to hold off until early 2016, most prominently from the IMF. The minutes from the FOMC’s last policy meeting, released in midweek, contained very little in the way of new information other than what we already knew. However, as some FOMC members are concerned about the developments in China and Greece, the Fed may after all wait until the start of 2016 before hiking interest rates. The prospects of rates remaining low for slightly longer than expected could potentially be bad for the dollar, but good for US stocks.
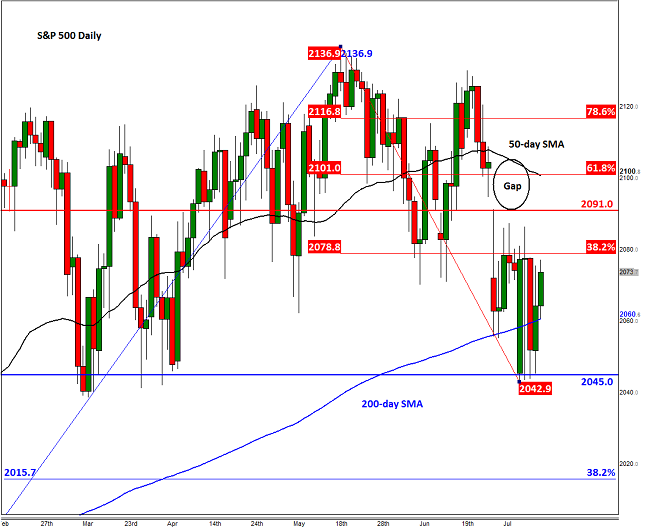
As well as China’s Shanghai Composite and Germany’s DAX, some of the key US indices such as the DOW and the S&P 500 have also found some support from their respective 200-day moving averages. This particular moving average is closely watched and it is thought that some money managers and hedge funds have specific rules that prevent them from buying markets which trade below these averages. Others, particularly those that believe in the theory of mean reversion, have strategies that require them to buy at or around the 200-day average. It is therefore encouraging to see these indices finding some much-needed strength at these levels. BUT it remains to be seen whether this bounce is indeed driven by strong buying pressure or merely short covering.
If the 200-day average support holds firm, a potential rally could be on the way, particularly as there are also a few gaps in the S&P that have yet to be “filled.” The index also created a long-legged doji candle on its daily chart on Tuesday which points to indecision. Tuesday’s ranges (2043-2086) should therefore be watched closely as a break could lead to a sharp move in that direction. If the break is to the upside, then the gap above the 2091 resistance level may get filled, leading to a rally to 2100 where the 50-day moving average meets the 61.8% Fibonacci retracement level. In contrast, if the break is to the downside then a sharp selloff could get underway next week, with the 38.2% Fibonacci retracement of the upswing from October, at 2015, being the immediate bearish target.
Source: FOREX.com. Please note this product is not available to US clients
Look Ahead: Commodities
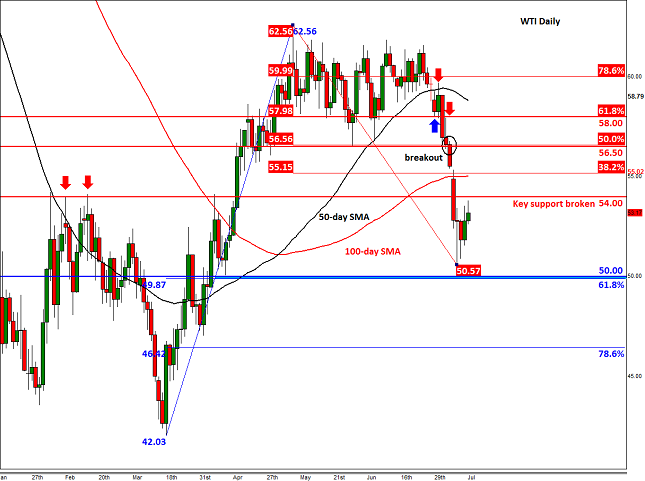
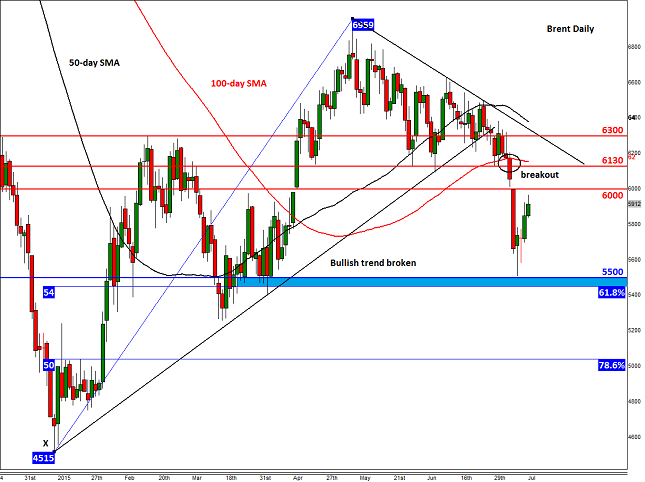
Oil prices have been very volatile this week following their technical breakdown at the start of this month. Though prices have bounced back strongly, mirroring similar moves in the Chinese and European equity markets, they remain vulnerable nonetheless. After all, the supply surplus is here to stay and it could get worse in the event of Iran’s full return to the market which could add an additional 1 million barrels of oil per day within six months. Admittedly, with Iran’s nuclear deal deadline being extended a couple of times, another important deadline has now passed – this one being in the US. President Barack Obama was meant to submit Iran’s nuclear agreement to the Congress for review by now. But obviously as this has not happened, the Congress could now take up to 60 days to review the accord, assuming a deal will be reached in the first place. Thus, the time at which Iran’s additional supply hits the oil market could still be months away. That being said, the effect of the delay would only be temporary. Indeed, according to the world's leading energy forecaster, the International Energy Administration (IEA), the "bottom of the market may still be ahead" as the world remains “massively oversupplied.”
Next week could see the market’s focus turn to the demand outlook for oil as there will be plenty of global macroeconomic data to ponder upon. Of particular interest will be the Chinese numbers on Monday and Wednesday, which include trade figures, industrial production and GDP. If these numbers point to further weakness for the world’s second largest economy and oil consumer then crude prices could fall sharply. Thus, we could be in for another wild ride next week.
The key technical levels for oil are clearly established. On WTI, the $54.00 handle will be important to watch (should we get there) for this was previously a strong resistance level and we are now trading back below it once again. Should the oil bulls manage to reclaim this handle then there is nothing much until $55.00/15; here the 100-day SMA meets the 38.2% Fibonacci retracement level of the most recent downswing. Thereafter is the point of the origin of the breakout at $56.50 which incidentally also corresponds with the 50% retracement level. As before, the key support is at around $50. As well as a psychologically-important point, this level marks the 61.8% Fibonacci retracement of the upswing from the March low. But given the manner in which oil has sold off (i.e. viciously), we wouldn’t be surprised if WTI goes on to even revisit the March low at $42.00 at some point down the line.
For Brent, the key resistance levels to watch are at $60 and then at $61.30. The latter corresponds with the point of origin of the breakout. The key support area is between $54.50 and $55 (shaded in blue on the chart). This is where the psychological $55 level meets the 61.8% Fibonacci retracement of the upswing from March. If decisively broken, the next stop for Brent could be at $50.00.
Source: FOREX.com
Global Data Highlights
UK:
14/07: CPI, June, 0830 GMT
The market is expecting a moderation in the annual rate back to 0% from 0.1%, while the core rate is expected to remain at 0.9%. This may raise concerns that inflation in the UK could take some time to make it back to the BOE’s target rate of 2%. Anything weaker than expected could trigger a sell-off in the pound.
14/07: Labour market data, May/ June, 0830 GMT:
The market expects another decent labour market report. The unemployment rate is expected to remain steady at 5.5%. The number of jobs created is expected to shrink to 35k in the three months to May, down from 114k in the three months to April, however this could be due to election distortions. The key thing to watch is the wage data. The market expects a massive 3.3% increase for May, the largest rise since early 2008. A strong wage reading could boost sterling.
US:
14/07: Retail sales, June, 1230 GMT
The market expects a moderation in the pace of retail sales for last month after May’s monstrous 1.2% gain. A 0.3% rise is decent, ex autos it rises to 0.6%, which would suggest that the weak oil prices continue to boost consumer spending. Another strong reading may be dollar-positive.
17/07: CPI, June, 1230 GMT
The market is expecting a slight increase in US prices for last month. The headline rate is expected to jump top 0.2% from 0%, which is still extremely weak, but suggests some inflation is starting to come into the system. The core rate is more interesting from a markets perspective, the core index is expected at 1.8%, up from 1.67%, which would erase May’s weakness. If the core rate comes in at 0.8% or above, then we could see a rally in the buck as it would help boost the chances of a Fed rate hike in September.
17/07: U. of Mich. Consumer confidence, July, 1400 GMT
The market expects another strong reading, with this index expected to rise to 96.5 after jumping from 90.7 in May to 96.1 in June. Another increase in confidence would suggest that economic momentum may be maintained into the start of the third quarter. A strong reading may be dollar-positive.
Europe:
14/07: German ZEW, July, 0900 GMT
This index is a good gauge of short term German investor sentiment. The market is expecting sentiment to tick lower in both the current situation and expectations component, although this could be due to the situation in Greece hurting investor confidence. If the Greek crisis can be resolved in the short term we would expect this index to pick up next month. Overall, a weak reading could be EUR-negative in the short term.
16/07: Eurozone CPI, June, 0900 GMT
This is the final revision from the preliminary reading released earlier. The market expects no change to the annual rate at 0.2%. If we see any weakness to this index then we could see the EUR sell off.
16/07: ECB meeting, from 1145 GMT
The market is expecting no change to Eurozone interest rates and no extension of QE. Watch the Draghi press conference at 1230 GMT; if the Greek crisis remains unresolved then we could see Draghi hint at an extension of the ECB’s QE program, which could boost stocks and weigh on the EUR.
Asia:
15/07: Bank of Japan meeting
No change is expected. Watch the Kuroda press conference at approx. 0630 GMT to find out if the BOJ is ready to add to its stimulus program in the event of China’s stock market volatility spilling over to Japan. If this happens then we could see weakness in the yen.
15/07: China Q2 GDP, 0200 GMT
The market expects a weak reading, with growth dropping to 6.8% from 7%, the lowest level since 2009. The risk is that the GDP figure is weaker. If that happens then we could see further risk aversion, particularly in Chinese stocks. We would also expect the Chinese authorities to take action if we get weak data, so watch out for a rate hike or something similar that could boost risk assets, particularly in China and Australia. It could be a volatile week.
