Highlights
- Market Movers: Weekly Technical Outlook
- SNB Shocker: What the CHF?
- FX Return Analysis: The SNB in Action
- Look Ahead: Equities
- Look Ahead: Commodities
- Global Data Highlights
Market Movers: Weekly Technical Outlook
Technical Developments to Watch:
- EUR/USD at a new 11-year low under 1.16 as traders look ahead to ECB meeting
- GBP/USD in no-man’s land between 1.50 support and trend resistance near 1.54
- USD/JPY testing key 38.2% Fibonacci support at 115.50
- EUR/GBP in play, channel support sits at .7600 ahead of key data
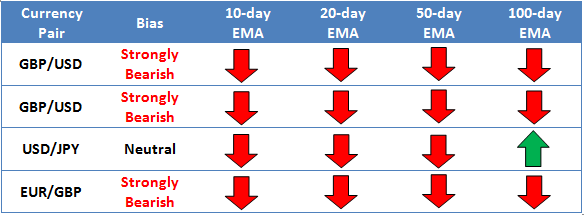
* Bias determined by the relationship between price and various EMAs. The following hierarchy determines bias (numbers represent how many EMAs the price closed the week above): 0 – Strongly Bearish, 1 – Slightly Bearish, 2 – Neutral, 3 – Slightly Bullish, 4 – Strongly Bullish.
** All data and comments in this report as of Friday’s European session close **
EUR/USD

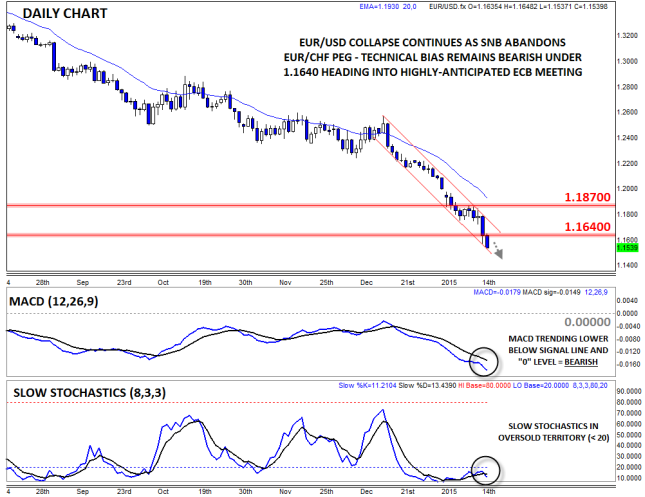
- EUR/USD hit an 11-year low under 1.16 as the SNB dropped the EUR/CHF peg on Thursday
- MACD strongly bearish, but Slow Stochastics in oversold territory
- All eyes on Thursday’s highly -anticipated ECB meeting
EUR/USD merely consolidated around 1.1800 for the first three days of the week until the Swiss National Bank announced it was abandoning its peg in EUR/CHF on Thursday. With a major euro “buyer of last resort” throwing in the towel, EUR/USD dropped all the way down to a new 11-year low under 1.1640 to trade in the mid-1.1500s as of writing. As you would expect after the prolonged downtrend, the pair’s MACD indicator is showing strong bearish momentum, though the Slow Stochastics are in oversold territory. For this week, traders’ fears of ECB QE and next weekend’s Greek elections could keep the pair under pressure, and once the ECB decision hits the wires on Thursday, all bets are off.
Source: FOREX.com

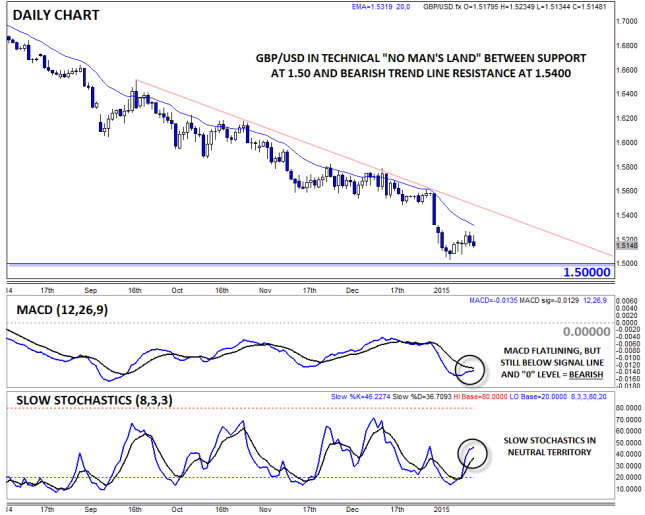
- GBP/USD recovered modestly last week, but remains in an overall downtrend
- Last week’s bounce took the Slow Stochastics out of oversold territory
- All eyes on remain on key psychological support at 1.50
Unlike its mainland rival, GBP/USD held up relatively well last week, managing to gain modestly to trade near 1.5200 as of writing. Despite last week’s bounce, the pair remains in an overall downtrend beneath its 20-day MA, though the secondary indicators are showing signs of improving: Both the MACD and Slow Stochastics are turning higher, but rates remain in a bit of a “no-man’s land” between key psychological support at 1.50 and trend line resistance around 1.54 for now, so the bias is generally neutral heading into this week.
Source: FOREX.com
USD/JPY

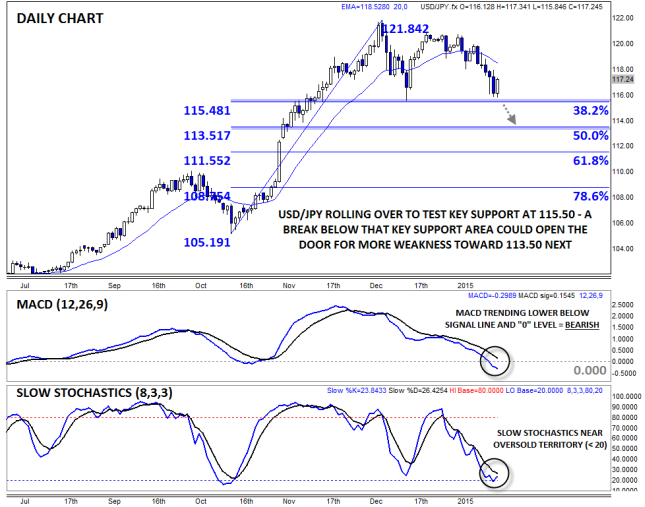
- USD/JPY rolled over back toward key support at 115.50 last week
- MACD crossed below “0,” though the Slow Stochastics is near oversold territory
- Critical support sits down at 115.50 – break below would be very bearish
A series of weaker-than-expected US economic releases drove the US dollar down against the Japanese yen last week, though the world’s reserve currency is managing a bit of a comeback as we go to press. The pair has now lost all semblance of upside momentum, though bulls remain somewhat optimistic as long as key support near the 38.2% Fibonacci retracement at 115.50 holds. Meanwhile, the MACD crossed below the “0” level, confirming the shift to bearish momentum, and the Slow Stochastics indicator is near oversold territory. For this week, all eyes remain on support at 115.50 – if that level goes, a deeper drop toward 113.50 (the 50% Fibonacci retracement) is possible.
Source: FOREX.com

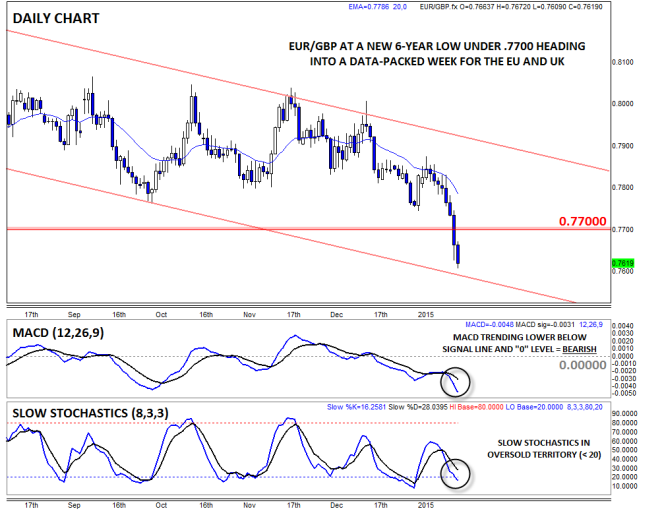
- EUR/GBP at a new 6-year low under .7700
- MACD shows bearish momentum, though Slow Stochastics oversold
- EU and UK data could set the tone for the next few weeks
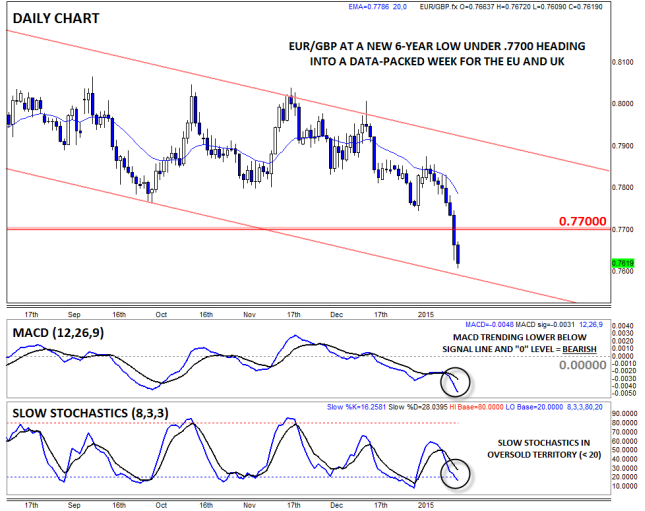
EUR/GBP is our currency pair in play due to a number of high-impact economic reports out of Europe and the UK this week (see “Data Highlights” below for more). Looking to the chart, the pair dropped below critical support at .7700 to hit a new 6-year low in the .7600s last week. The pair’s MACD indicator is trending lower below both its signal line and the “0” level, showing strongly bullish momentum, though like the EUR/USD, the Slow Stochastics are probing oversold territory. For this week, fundamental data will the primary driver of trade, but the medium-term bias will remain lower beneath previous support at .7700.
Source: FOREX.com
SNB Shocker: What the CHF?
Looking back, last week was historic for the FX market. EUR/CHF had a 2000+ pip decline in a matter of minutes, the market questioned the credibility in the SNB, and the prospect of QE from the ECB this week is considered to be in the bag.
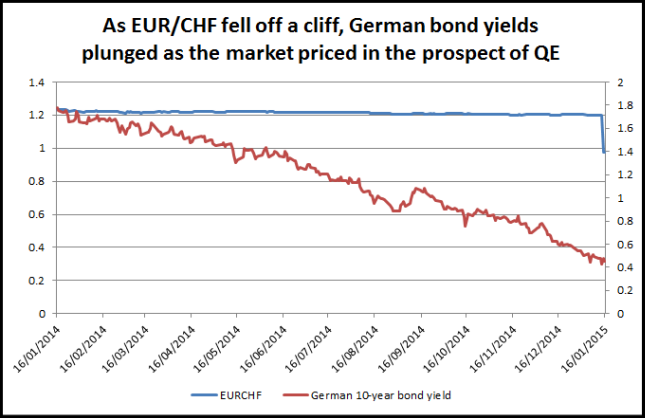
The riskiest assumption about last week’s events is, of course, the ECB move. The bank never pre-commits to policy changes, and after the SNB move caused EUR/USD to fall to a fresh 11-year low, does the ECB actually need to embark on QE? Some would argue no. Not only is the currency weak, but European bond yields fell to record lows. German bond yields plunged on Thursday (see chart below) and Spanish, Italian and even Greek yields were lower on the week.
But the SNB move actually puts the ECB in a difficult position – expectations are rising for a big ECB-shaped bazooka. After the SNB action, the market may look for EUR 1 trillion in asset purchases (QE), and potentially a simultaneous cut in the deposit rate deeper into negative territory. It is questionable if the ECB can deliver this, especially as we know that Germany has been reluctant to allow the ECB to embark on QE in the past.
Thus, the biggest risk for the FX market this week is a disappointment from the ECB. However, the upside for EUR/USD could be limited. We believe that one reason why the SNB decided to ditch its currency policy was that it was getting too expensive. The SNB’s balance sheet was approaching 75% of Swiss GDP, its FX reserves had soared to CHF 500bn and 45% of them were held in EUR. Since the EUR has been steadily declining since mid-2014, the SNB was holding an expensive, loss-making asset on its balance sheet. Going forward, it may want to diversify some of its EUR holdings, which could further add to EUR selling pressure later this year.
Overall, the SNB’s move suggests that the Swiss don’t have a huge amount of confidence in the EUR’s value going forward, so should we be poised for life below 1.10? How about parity at some point this year? That is no longer beyond the realm of possibility but whether or not we get there could depend on the USD. If the Federal Reserve continues with its plan to keep normalizing interest rates this year then there could be further EUR weakness to come.
Source: FOREX.com
FX Return Analysis: The SNB in Action
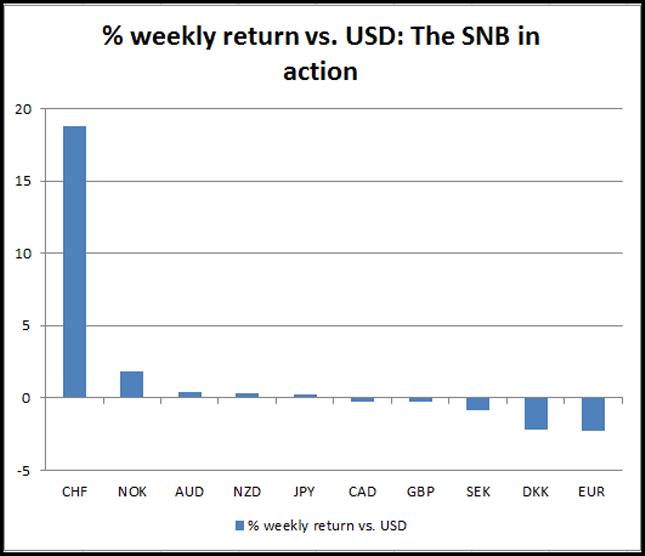
The chart below shows the performance of the G10 currencies against the dollar for last week. As you can see, the G10 FX space was dominated by the Swiss franc. By the time the European markets had closed, the CHF was still 18% higher than the USD, illustrating the severe impact the SNB actions had on the world of FX.
The notable underperformer was the EUR, which fell to a fresh 11-year low vs. the USD below 1.15 at one stage. It ended the week down more than 2.5%, after the move by the SNB removed a key pillar of support for the EUR and after two Greek banks said that they would approach the ECB for precautionary funding ahead of next week’s Greek elections.
Interestingly, the movement in the rest of the G10 FX space was fairly minimal as the focus was firmly on the EUR/CHF peg. The Norwegian krone was also a surprisingly strong performer. After falling more than 20% vs. the USD in 2014, the Nokkie was due a recovery especially after the oil price rallied more than 10% at one point last week. This helped the commodity currencies, especially those that had been under pressure like the Nokkie, to stage a mini recovery and there could be more in the pipeline if commodities continue to recover.
After a week of such extreme moves, we expect the FX market to calm down somewhat next week even as we approach some key event risk including the ECB meeting and Greek elections. The move by the SNB could confirm some trends in the FX market that had started to take shape last year. The CHF is likely to remain strong as EUR/CHF tries to find its new equilibrium without SNB support. The EUR has broken to a fresh 11 year low, and although the EUR looks stretched to the downside, it may be some time before we can expect a short squeeze with key eurozone event risks on the horizon.
Overall, last week’s events are a keen reminder of the power of central bankers in the FX market. The SNB has caused carnage: billions were wiped from the Swiss stock market, FX companies went bankrupt and holders of Swiss mortgages have found that their repayments are a lot more expensive today. This makes one wonder what a Fed rate hike could do to the market….
Source: FOREX.com
Look Ahead: Equities
What a volatile week it has been in the financial markets! Obviously the EUR/CHF was the epicenter of the turmoil after the Swiss National Bank surprisingly pulled the rug from under the bulls’ feet on Thursday and let the dormant currency pair plummet to below parity from 1.20. Swiss stocks plunged too, which saw the benchmark SMI index erase its entire 2014 gains in just a couple of hours. Shareholders in Swiss exporters such as Swatch and Richemond and financials including Credit Suisse took the brunt of the sell-off. Shockwaves from Switzerland were being felt across the global markets, including even the US. Here, the losses were relatively moderate however with the major indices ‘only’ falling by about 2% each. In contrast, the major European indices were able to quickly recoup their losses and some even ended Thursday’s session higher, before extending their gains on Friday. In fact, Germany’s DAX index hit a fresh all-time high on Friday despite all the turmoil. The V-shape recovery in the European markets (ex-Switzerland) suggests traders may now be fully expecting the introduction of a full-blown QE stimulus program from the ECB on January 22. This also means however that the risk of a sharp correction is very high if these expectations are not met. Even if the ECB does announce QE, the size and structure of it may not please the market.
In the US, the Federal Reserve is still expected to embark on a rate hiking cycle at some stage this year. However, the recent US macroeconomic pointers have not been great to say the least, especially inflation data (because of the crude oil slump). In fact, the consumer price index (CPI) fell 0.4% last month following a 0.3% decline in November. This was the biggest decline since December 2008, pushing the annualised rate down to 0.8% from 1.3% previously. As inflation is currently running below the Fed's 2 per cent target, interest rates may be kept lower for long even if the labor market improves further over the coming months. This could help to keep the US stock markets elevated for the foreseeable future.
As well as the ECB on Thursday, we will also have several other data releases in the coming week which could help support the stock markets. On Tuesday, for example, we will have the latest GDP and industrial production numbers from China, and the German ZEW survey. The BoJ policy meeting is on Wednesday when we also have some housing market data from the US and jobs numbers from the UK. Friday is another busy day with lots of PMI readings and some more US data. Meanwhile the US fourth quarter earnings season has not started greatly with JPMorgan Chase & Co (NYSE:JPM), Wells Fargo & Company (NYSE:WFC), Bank of America Corporation (NYSE:BAC), Citigroup Inc (NYSE:C) and Goldman Sachs Group Inc (NYSE:GS) all reporting disappointing numbers. This has weighed on the sentiment, causing US stock indices to underperform their European peers. Earnings will kick into a higher gear next week and depending on the outcome of those, the market could find clearer direction. The most important earnings results are listed below:
- Tuesday: Advanced Micro Devices Inc (NASDAQ:AMD), Johnson & Johnson, Morgan Stanley, Netflix Inc (NASDAQ:NFLX), Unilever (NYSE:UL)
- Wednesday: American Express Company (NYSE:AXP), eBay Inc (NASDAQ:EBAY), US Bancorp, United Health
- Thursday: Starbucks Corporation (NASDAQ:SBUX), Verizon Communications Inc (NYSE:VZ)
- Friday: Bank of New York Mellon, General Electric Company (NYSE:GE), Honeywell International Inc (NYSE:HON),
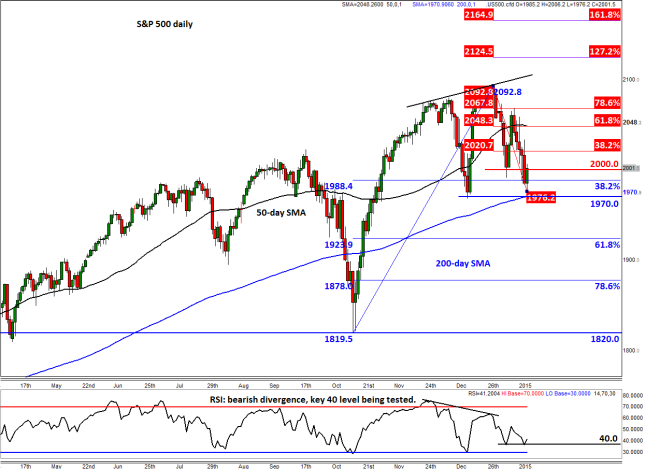
Meanwhile from a technical point of view, the S&P was hovering around the psychological 2000 mark as we go to press. It is holding its own above the 38.2% Fibonacci support (1988) following a five-day sell-off. The bias is currently neutral to slightly bullish and will remain that way for as long as it holds above 1970. As well as the 200-day SMA, this level also marks the prior low. Thus a closing break below it could be a bearish development, which may lead to a drop towards 61.8% Fibonacci retracement level at 1924 and possibly even lower next week. On the upside, the key resistance level to watch is around 2048/50 where the 50-day moving average converges with the 61.8% Fibonacci retracement level of the most recent downswing. Meanwhile the RSI is continuing to trend lower after it recently created a bearish divergence (which correctly signaled the start of a downward move). The popular momentum indicator is now testing the key 40 level; a potential break below here would point to a sharper correction in the underlying index.
Source: FOREX.com. Please note this product is not available to US clients.
Look Ahead: Commodities
Crude oil’s mid-week rally came to an abrupt halt on Thursday as both oil contracts failed to hold their own above the psychologically important $50 a barrel after recovering from Tuesday’s low of around $45. Although crude prices bounced back again on Friday, they still remain slightly lower on the week and further losses may follow at the start of next week. Friday’s gains reflect growing expectations that that the oil market will tighten around the middle of this year as weaker prices help underpin demand and at the same time undermine non-OPEC supply growth. This view was underscored by the International Energy Agency (IEA), which cut its 2015 non-OPEC oil production growth estimate by 350 thousand barrels per day to 0.95 mb/d from its December forecast. The OPEC has already trimmed its estimate for non-OPEC supply growth by a smaller amount of 80 Kb/d to 1.28 mb/d, while the other remaining of the three leading oil agencies – the Energy Information Administration (EIA) – envisages a much smaller 0.7 mb/d increase in supply this year. If non-OPEC supply grows considerably below expectations, it is possible that WTI could trade at a premium over Brent at some point this year. Although there is no sign of that happening yet, the fact that US drillers have been scaling back their operations in recent weeks suggest that oil output may actually fall back. According to data from Baker Hughes, the number of oil rigs in use fell by 61 units last week to 1,750 from 1,811 the week prior. For some shale oil producers to actually exit the market altogether, oil prices will need to remain low for a long enough period of time, say six months around $40-50 a barrel. But if it does become apparent all of a sudden that the market is actually tighter than expected, prices could stage a recovery which would thus help to alleviate pressure on some of the weaker oil producers.
But in the short term as supply continues to rise, this will prevent, in our view, a notable price recovery any time soon. Indeed, the OPEC alone produced some 30.2 million barrels of oil in December. Increased crude output in Iraq outweighed supply disruptions in countries such as Libya. In fact, according to media reports, Iraq’s output could expand even further in the coming weeks with production in the Kirkuk region set to double to 300 kb/d. If this trend continues, more oil will be produced than required. The OPEC has meanwhile lowered its estimate for this year’s call on the cartel slightly to 28.78 mb/d from 28.90 mb/d in the previous month. In the US, crude stockpiles are continuing to grow. The usual weekly EIA report on Wednesday showed that US stocks rose by a much-larger-than-expected 5.4 million barrels last week. Inventories are already at their highest ever level for this time of the year and if the next report (which will come out on Thursday, a day later than usual due to the Martin Luther King Day holiday on Monday) shows another increase then oil prices could fall further. Although demand expectations have played little part in determining the direction of oil prices, there are a few macro pointers worth keeping an eye on next week. These include Tuesday’s Chinese GDP and industrial production numbers, and the latest German ZEW economic survey; US housing starts and building permits will come out on Wednesday, followed by the global manufacturing PMI readings on Friday.
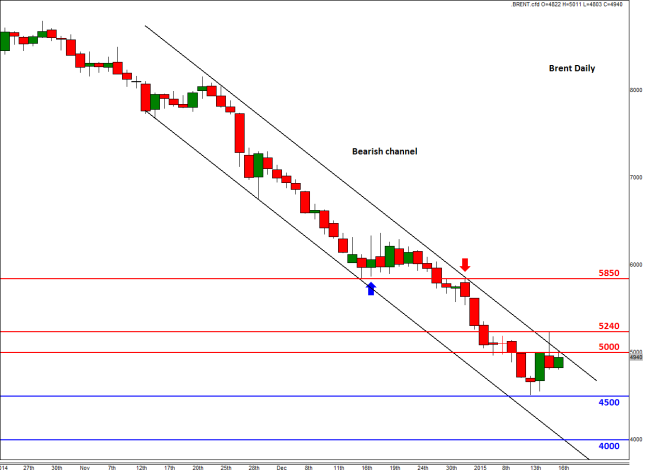
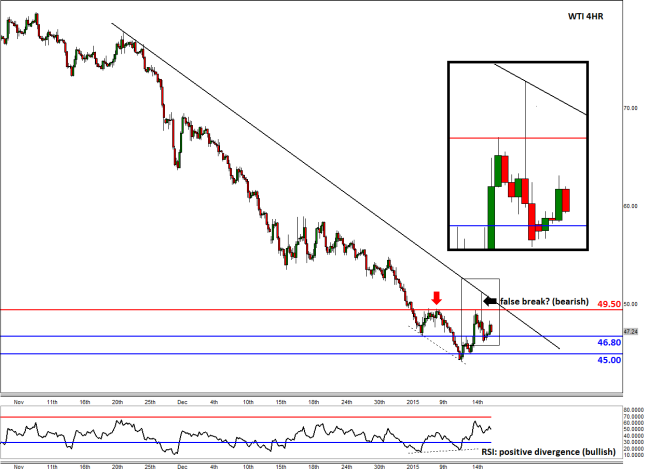
Brent oil created an inverted hammer candle on its daily chart on Thursday, suggesting a change of control from the buyers to the sellers once again. Although the buyers have lost some control on Friday, they are still the more dominant force and this is highlighted by the bear’s inability to break the bearish channel. Thus, the path of least resistance continues to be to the downside for Brent and $45 or even $40 could be the next downside targets for the bears. However, the near-term technical outlook will turn slightly bullish if Brent stages a rally above this week’s high of $52.40. In that case, a move towards the next major resistance – previously support – at $58.50 could be on the cards. WTI has created a potential false breakout pattern above $49.50, which suggests there was lack of conviction from the buyers to hold on to their bullish positions. As such, the short-term trend for WTI also remains bearish, until proven wrong.
Source: FOREX.com. Please note this product is not available to US clients.
Source: FOREX.com. Please note this product is not available to US clients.
Global Data Highlights
Monday, January 19, 2015
MARTIN LUTHER KING DAY
Tuesday, January 20, 2015
2:00 GMT Chinese Gross Domestic Product (Q4)
Despite all the worries about a Chinese slowdown of late with Manufacturing PMI falling below the 50 level, other economic factors really aren’t that bad. Trade Balance has been strong, inflation is somewhat stable (especially compared to the rest of the world), and Services PMIs are still safely above the 50 level. GDP though has been on a steady decline over the last 4-5 years, falling from nearly 12% to the current mid-7% levels. Expectations are for this to fall to 7.2% and would continue the declining trend, but if it were to better that level, depressed currencies like the AUD and NZD could benefit.
10:00 GMT German ZEW Survey (January)
Many prognosticators around the world are expecting the ECB to introduce QE later in the week, and along with the recent peg-dropping procedure by the Swiss National Bank, it will be interesting to see how the German economic sentiment is doing. Expectations are for this figure to rise, as it has done the previous two releases, but with all the uncertainty, don’t be surprised to see a fall which may depress the EUR even further.
21:45 GMT New Zealand Consumer Price Index (Q4)
There are a few factors that could be working against this figure that were prevalent in Q4 for New Zealand. Along with the rest of the world, inflation in general has been falling; just take a look at the eurozone and the US for prime examples of that phenomenon. New Zealand’s inflation never really got started as it has been mired below 1% since mid-2011. Additional mitigating factors though include falling oil and milk prices, a double whammy for the NZ inflation figure. The last three readings have all measured 0.3%, and considering the global climate, this one may not even reach that level.
23:30 GMT Australian Westpac Consumer Sentiment Index (January)
When simply looking at the Australian economic releases this month, one could make a legitimate argument that Aussie consumers are generally happy. While Retail Sales and Home Loans didn’t live up to expectations, Trade Balance, Building Approvals, Job Ads, and the Employment situation appear to be strong. Nothing makes consumers happier than seeing the Unemployment Rate fall, so posting a 6.1% rate on expectations of 6.3% could make a few undecided people turn more optimistic.
Wednesday, January 21, 2015
TENTATIVE Bank of Japan Monetary Policy Statement and Press Conference
As the SNB showed us this past week, we should never look past a central bank and simply assume that they will do nothing to rock the boat. Many feel the action by the SNB was in direct response to their knowledge that the ECB will be introducing QE at their meeting on Thursday. Could this be a waterfall-like coordinated action by central banks as most of them have meetings this week before the ECB? Coordinated actions by central banks aren’t common, but they do happen, and typically it is all at once, but a “CYA”-type of event from multiple banks in succession isn’t out of the question. If the BoJ increases QQE again at this meeting, conspiracy theorists will be packing the forums, so be cautious.
4:30 GMT Bank of England Monetary Policy Committee Vote Count and Meeting Minutes
As mentioned above, there isn’t much expected from the BoE, but that doesn’t mean they won’t do anything. If the BoJ acts, it may be wise to give a side-eyed look at the BoE to see if they are in on the fix.
4:30 GMT UK Claimant Count Change (December)
The employment situation in the UK has been getting progressively better for the last few years as Claimant Count Change has only missed consensus 9 times since mid-2011. Unfortunately, two of those misses have come in the last 3 months as expectations have gotten more positive. Consensus this time around appears to be capitulating a bit and is less than the actual result last month, so it appears the majority doesn’t expect a strong figure. If consensus can be beaten, watch for broad GBP strength particularly in the EUR/GBP.
13:30 GMT US Building Permits and Housing Starts (December)
Both of these figures have been above the 1M psychological figure for the last three months, and that trend is expected to continue. By most accounts, the US housing market has continued to improve with prices rising and the overall US economy getting stronger. While a surprise fall back below 1M is always possible, it is unlikely for these reports, and the market may be more preoccupied with central bank watching for this to make much of a dent.
15:00 GMT Bank of Canada Monetary Policy Decision, Report, and Statement, and Press Conference
The BoC is one of the minor players of the big central banks, but it would be foolhardy to overlook them considering the extreme market conditions recently. The CAD has lost a lot of value of late thanks to falling oil prices, but those two offset each other considering Canada’s reliance on the commodity. Once again, not much is expected from the BoC, but if the dominoes are falling with other central banks, they may be forced to either act in some way or promise to in future meetings.
Thursday, January 22, 2015
12:45 GMT European Central Bank Interest Rate Decision, Statement, and Press Conference
This will be the main focus of the market for the week as most market participants feel that QE is coming. How much it will be, the length of time, and how it will be implemented will be of particular interest. However, if Mario Draghi and Co. don’t introduce QE, or they bring forth less than 500M euros, the carnage of the aftermath could look a lot like the post-SNB situation. At this point, all signs point to substantial QE and extreme EUR devaluation, but as they say in this industry, watch for the “buy the rumor, sell the news” type of reaction.
13:30 GMT US Initial Jobless Claims (January 16)
This event is likely to be a minor footnote on the day as Mario Draghi will begin speaking when it is released, but it is interesting to note that it jumped back above 300k this past week for the first time in two months. Perhaps it was a minor blip in the further decline similar to the 313k reading in November, but if it were to register another 300k+, skepticism in the continued strength of the US economy may get louder.
Friday, January 23, 2015
9:30 GMT UK Retail Sales (December)
Expectations for this release are extremely depressed at -0.6% after seeing a very positive 1.6% rise last month. One of the main reasons for the lowered consensus is that out of the last 11 times it has increased more than 1%, it was negative in 8 of the next months. Considering the low bar set, it may be very easy for this figure to beat consensus and give the GBP some room to run higher.
9:30 GMT US Existing Home Sales (December)
After posting five straight months of 5M+ results, this measure missed that figure last month by printing at 4.93M. While one miss doesn’t doom a trend, another print below 5M could allow doubt to begin to creep in, particularly if Building Permits and Housing Starts miss as well. Considering all the USD love over the last few months investors may be getting a little exhausted and look for an excuse to take profits on the USD longs if that were to happen.
