Market Movers: Weekly Technical Outlook - Technical Developments to Watch:
- EUR/USD edging above falling wedge pattern – key resistance at 1.2500
- GBP/USD similarly peeking above bearish trend, but still rangebound
- USD/JPY uptrend intact above last week’s low in the mid-117.00s
- USD/CAD in play, bullish channel continues to guide rates higher
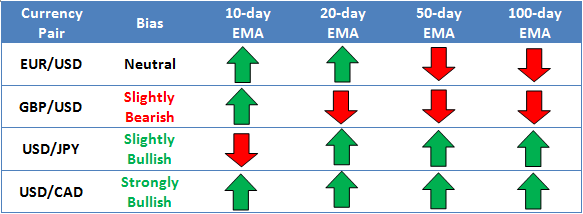
* Bias determined by the relationship between price and various EMAs. The following hierarchy determines bias (numbers represent how many EMAs the price closed the week above): 0 – Strongly Bearish, 1 – Slightly Bearish, 2 – Neutral, 3 – Slightly Bullish, 4 – Strongly Bullish.
** All data and comments in this report as of Friday’s European session close **
EUR/USD

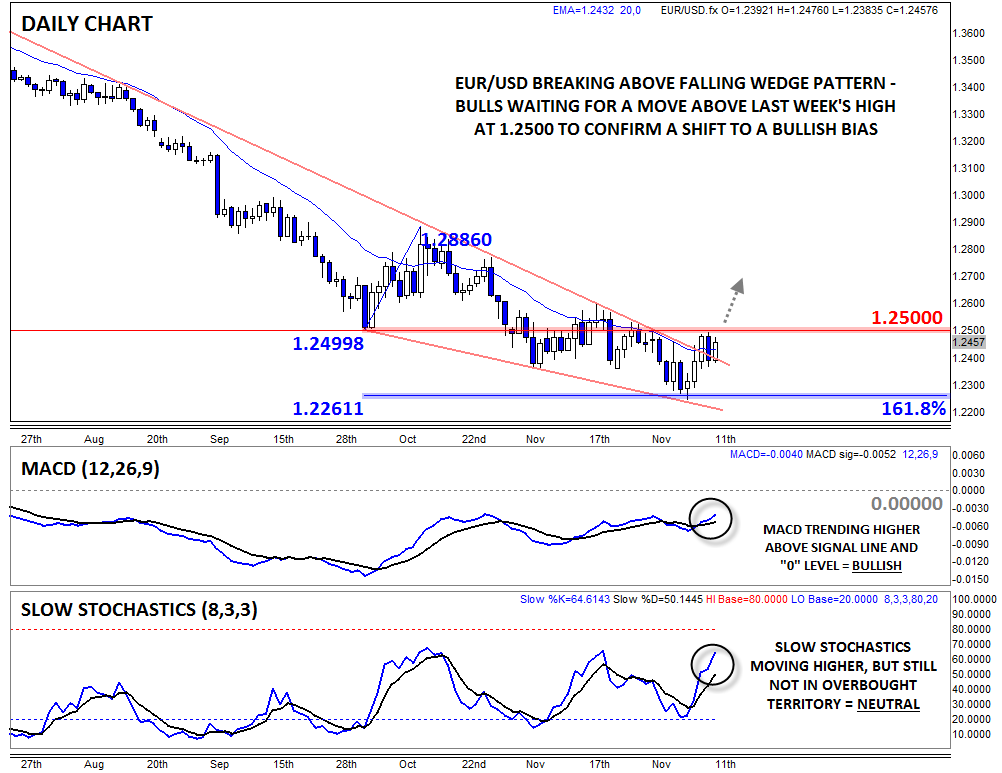
- EUR/USD broke out of its falling wedge pattern last week
- MACD turning back higher toward the “0” level
- Bias remains neutral below last week’s high at 1.2500
EUR/USD rallied strongly last week, with rates breaking above the multi-month bearish trend line near 1.2400. This also represents a bullish breakout from the recent falling wedge pattern, suggesting that a more substantial rally is possible heading into the new year. Meanwhile, the MACD indicator has also turned higher and is now approaching the “0” level, showing that bearish momentum is dissipating. For now, the bias on the pair remains neutral, but a break above last week’s high at 1.2500 would be a strong bullish sign.

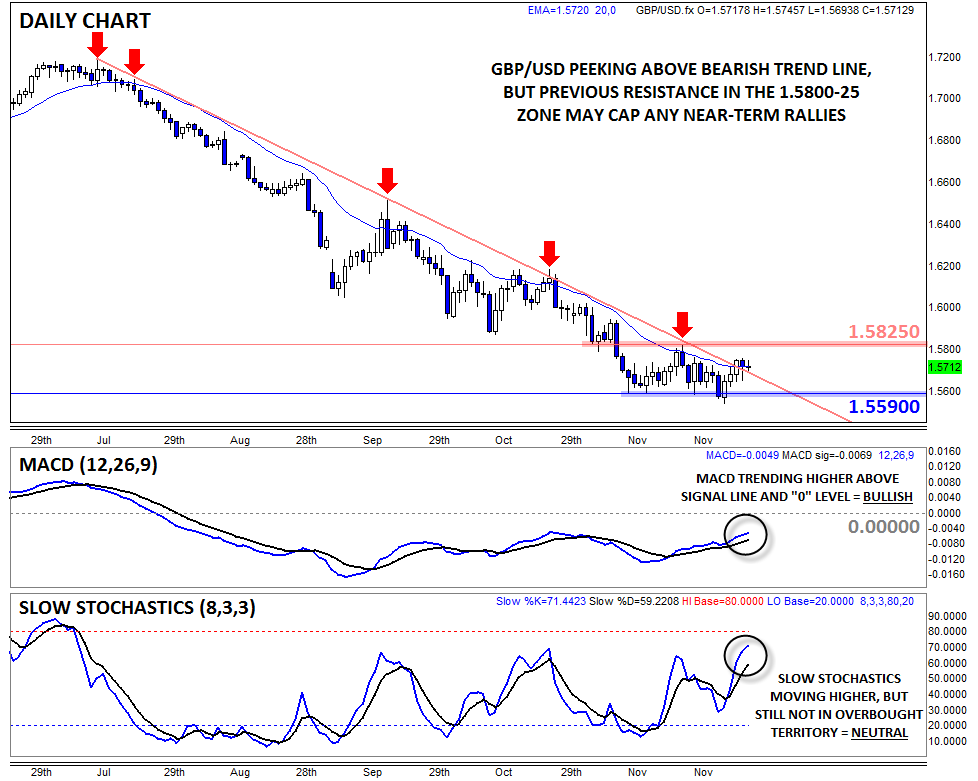
- GBP/USD also edged above its bearish trend line
- MACD continues to moderate back toward the “0” level, showing receding bearish momentum
- Chance for a continuation toward the top of the recent range at 1.5825 next
Like its mainland rival, GBPUSD rallied last week to peek above its multi-month bearish trend line. As of writing, the pair appears set to close above that level, though a break of a bearish trend line, in and of itself, does not suggest an immediate shift to a new bullish trend; instead, rates may continue to consolidate within the recent sideways range from 1.5590 to 1.5825. Both the MACD and Slow Stochastics have turned higher, suggesting a near-term rally toward the top of the range at 1.5825 is possible this week.
USD/JPY

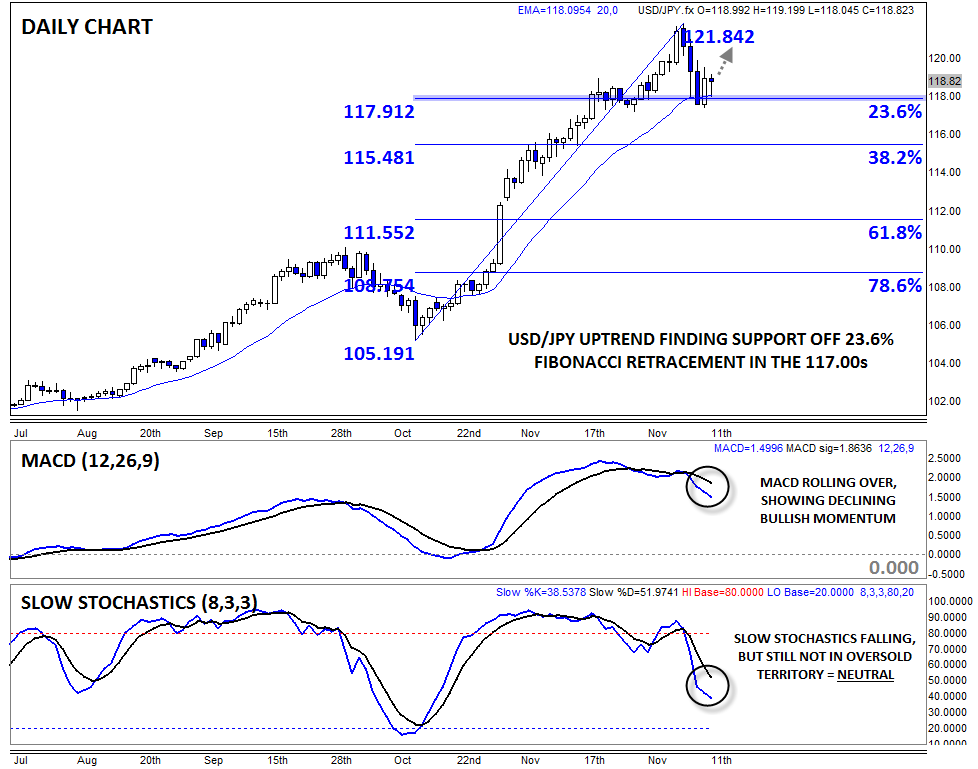
- USD/JPY pulled back to 23.6% Fib support at 117.90 before bouncing to close the week
- Last week’s dip took the Slow Stochastics out of overbought territory
- Bias remains bullish above last week’s low near 117.50
USD/JPY finally pulled back early last week, shaking out some of the low conviction longs, but dip buyers quickly stepped in around 23.6% Fibonacci retracement support in the upper-117.00s. As we noted on Wednesday, we’re inclined to give the established bullish trend the benefit of the doubt for now. Meanwhile, last week’s dip alleviated the overbought condition in the Slow Stochastics indicator, though the MACD has now rolled over. This week will be critical for USD/JPY, but our bias remains higher above last week’s low near 117.50
USD/CAD

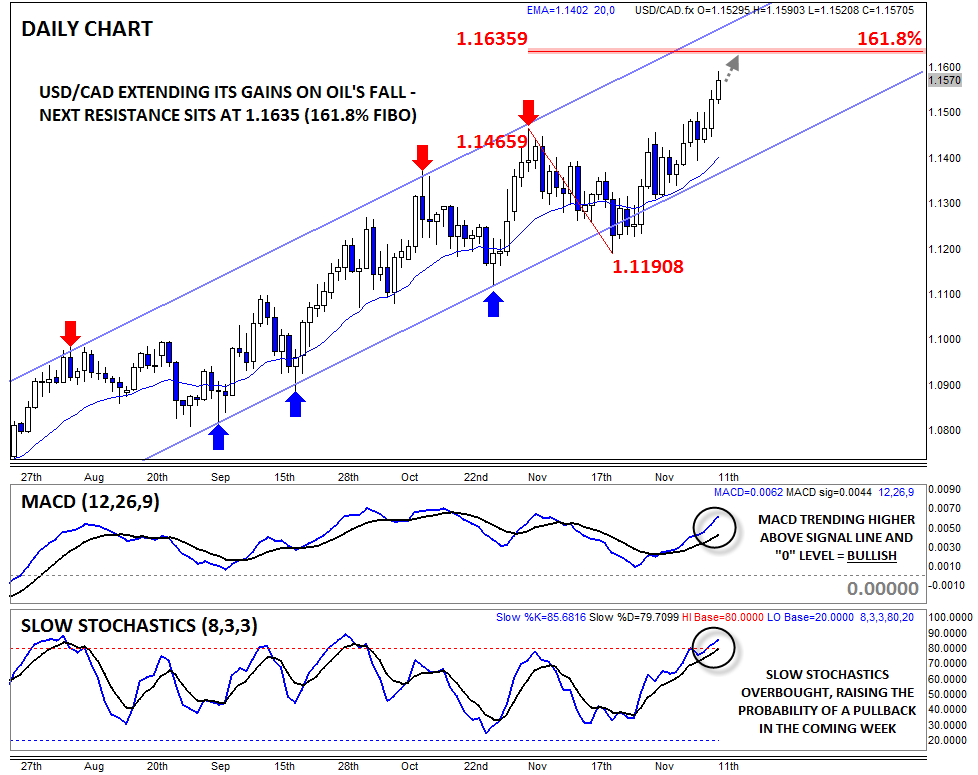
- USD/CAD rallied to a new multi-year high near 1.1600 last week
- MACD shows bullish momentum, but Slow Stochastics peeking into overbought territory
- Path of least resistance remains higher above channel support in the mid-1.13s
USD/CAD is our currency pair in play due to a number of high-impact economic reports out of the US and Canada, including the highly-anticipated Federal Reserve monetary policy meeting (see “Data Highlights” below for more). Looking to the chart, the pair remains within a healthy uptrend within its 4-month bullish channel. The MACD is trending higher above its signal line and the “0” level, showing bullish momentum, but the Slow Stochastics indicator has peeked into overbought territory, raising the probability of a pullback this week. Nonetheless, the pair’s medium-term bias remains bullish above channel support in the mid-1.1300s
If PM Abe’s Victory is in the Bag, What Does That Mean for JPY?
On Sunday 14th December, Japan will head to the polls to vote in the Lower House Election. This snap election was called by President Abe to ensure that he has the public’s backing for his economic reform plans after the economy contracted in the third quarter. Ironically, as the election has neared, Abe has distanced himself from his economic reform program and plans to reign in Japan’s huge debt. For example, he has delayed the second installment of the increase in the sales tax, instead focusing on ways to add more stimulus and end the economic malaise that Japan finds itself in.
The latest opinion polls suggest that Abe will win a large majority on Sunday, and this appears to be what the market is expecting. However, if Abe is given a mandate to embark on his economic policy program, his recent rhetoric suggests that 2015 will be another year when the Japanese government focuses on the first two arrows of Abenomics: stimulus spending and monetary policy largesse. The third arrow, economic reform, may stay on the back-burner for some time yet.
Is sentiment to the yen shifting?
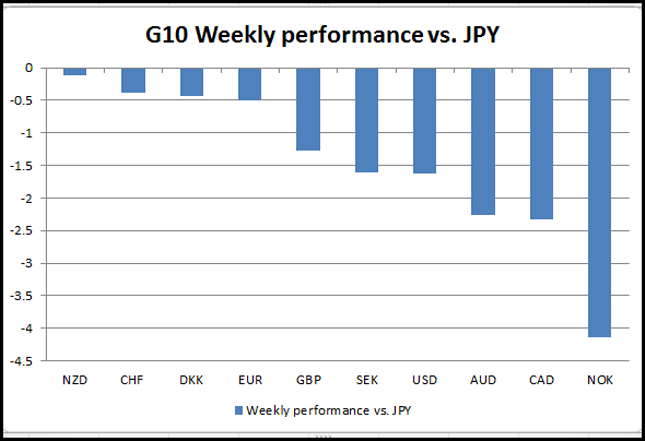
As we lead up to the election, the yen has had its best weekly performance in 16 months. The JPY is the top performer in the G10 this week and is up against all of its G10 peers. It has done particularly well versus the commodity currencies including the NOK (up more than 4%), the CAD (up 2.3%) and the AUD (up 2.2%). The yen is benefitting not only from inflows before the election, but also from the oil price decline. Since the nuclear disaster in 2011, Japan has been a major oil importer, so a falling oil price is good news for Japan’s terms of trade hence its strong performance versus the commodity bloc of currencies.
The strong oil price may not be the only thing propping up the JPY in the coming weeks. The BOJ may refrain from embarking on more stimulus next year, even if the government feels that more stimulus is needed. Firstly, the BOJ already extended its stimulus program at the end of October. Secondly, the fall in the oil price could boost consumption and spur inflation. With prices already running above the BOJ’s 2% target at 2.2%, there is less pressure for the BOJ to react immediately to any disinflationary impulses coming from the sharp drop in the oil price.
The Tankan index for the fourth quarter, which is released on Monday, is expected to remain steady, with the headline index coming in at 13. Business investment is expected to moderate slightly to 8.1% in Q4, from 8.6% in Q3. This also supports the BOJ remaining on hold as we move through to the New Year, which could help to stabilize the JPY in the coming days and weeks.
However, the outlook for the JPY in the next few days could depend on two factors. We could see the JPY give up some recent gains if PM Abe wins the election as expected and if the Tankan meets expectations. Since the JPY is perceived as a safe haven, it tends to come under pressure on the back of good economic news at home. Selling pressure on the JPY could intensify after the FOMC meeting this week. If the Fed drops its phrase “considerable time” in reference to the next rate rise, then we could see a sharp reversal in USD/JPY, and rising US rates could see this pair climb to prior highs at 121.85 – the high from 8th December.
However, in the longer term, those looking for 140 in USD/JPY by the middle of next year could be a little over optimistic if the BOJ doesn’t embark on more stimulus, no matter what Mr. Abe says.
The nose-diving crude oil prices (see below) have thus far been unable to support the stock markets conclusively. Although shares in airlines have benefited for obvious reasons, these have been more than offset by the slump in energy stocks. But judging by the performance of the stock markets as a whole, and ignoring the other factors that are also weighing on the sentiment, investors are sceptical that the weaker oil prices will give the consumer and in turn the global economy a major boost. Indeed, given the assumption that the markets move on expectations, so far we haven’t seen the consumer discretionary sector receiving any major benefits. One reason for this could be that the market is more concerned about the potential costs of the crude’s slump than benefits, for after all a weaker oil price would deepen the deflationary pressures in the major economies such as Japan and the Eurozone. Deflation is very bad for an economy because consumers would put off purchases of high ticket items in the hope that prices will fall further in the future. This could send the economy into a vicious cycle and lead to a prolonged recession or even a depression.
Given the dangers of deflation, we believe the ECB in particular should do more to help create inflation. In this regard, next week’s key fundamental events could increase the pressure on the central bank. The European manufacturing PMIs and the German IFO will be watched closely as investors look for clues in terms whether the weaker crude prices have had any positive impact on the industrial sector. Next week we will also have the FOMC meeting on Wednesday December 16. At the corresponding press conference, there is a chance that Janet Yellen could deliver a surprisingly dovish message which could spark a rally in global markets and a sell-off in the dollar.
The S&P 500
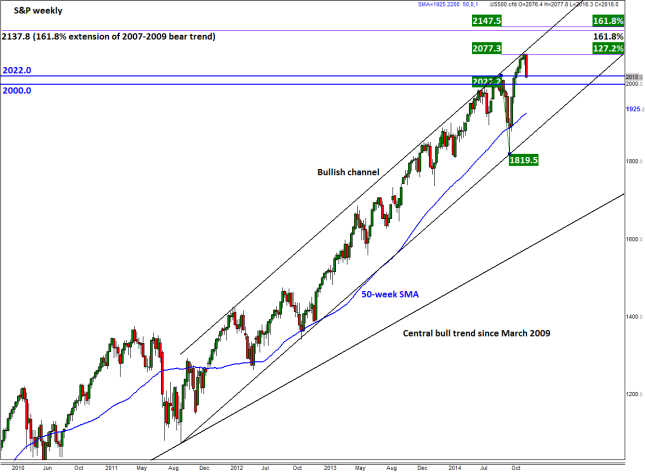
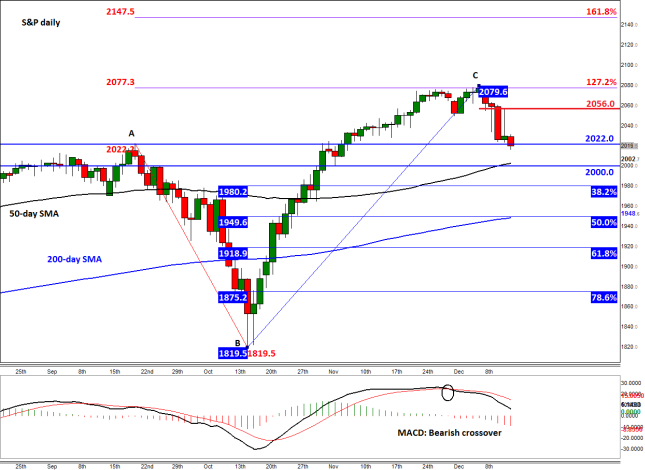
But ahead of the FOMC meeting, the S&P 500 is set to close the week decisively in the red. As per Monday’s report, we were fully expecting the S&P to stage a pullback from the record highs this week. As a reminder, the index was testing the resistance trend of its long-term bullish channel on Monday at just shy of 2080 following a sharp rally that had initiated from the support trend of the channel in mid-October. Incidentally, the 127.2% Fibonacci extension level (2077) of the move down from September was also converging with the resistance trend of the bullish channel there. Given the technical importance of this area and the behavior of past price action around the trend line, we said that there was “a good chance the index may stage a deeper retracement now, with a potential for a drop towards the old resistance levels at 2022 and 2000 being very much possible.” Indeed, this is exactly what has happened. At the time of this writing on Friday morning, the index was trading just below the 2022 level and was threatening to break further lower. As a result of the sell-off, the momentum indicator MACD is now trending lower after it had formed a bearish crossover at the end of November.
While the probability for a bounce increases as each day goes by, there is still room for further downside over the coming weeks. Indeed, the S&P could potentially drop all the way towards the support trend of its bullish channel around 1875 (depending on how it gets there, if it does at all). In other words, there is a danger that the index may lose nearly 205 points from its December peak, which would thus represent a drop of almost 10%. But ahead of 1875 there are several other key technical levels that may also hold as support, in particular the Fibonacci retracements of the rally from mid-October. The 38.2% retracement comes in at 1980 while the 61.8% sits at 1919. In between these levels is the 50% retracement at 1950 which also converges with the 200-day moving average. Further lower still is the 78.6% retracement at 1875 – as mentioned this also converges with the support trend of the long-term bullish channel.
So, it is worth keeping a very close eye on the abovementioned support levels in case we do see a bounce back. At this stage, we are looking for a break above the previous intra-week high of 2056 for a confirmation that the corrective trend has ended.
Look Ahead: Commodities
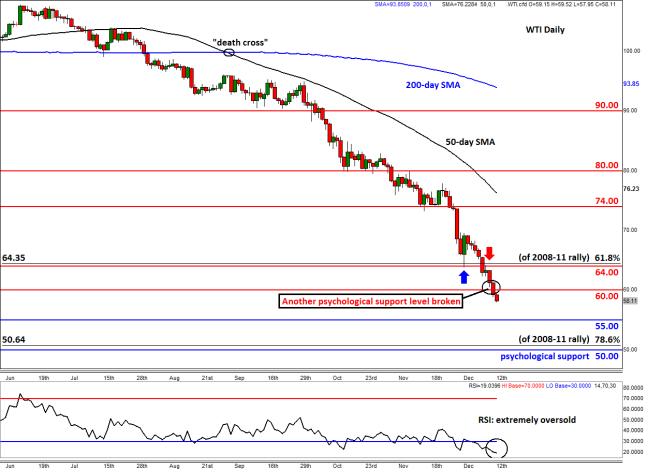
As another week draws to a close, there is still no end in sight for the plummeting oil prices. Both the major oil contracts have dropped to fresh five-and-a-half year lows and broken through some key psychological levels with Brent taking out $65 and WTI $60. Up until this week, prices had been falling mainly on concerns about the excessive supply of oil which has led to a price war even within the OPEC itself with Saudi Arabia and Iraq slashing their prices below international benchmarks. However it was demand rather than supply worries that was chiefly responsible for this week’s selling. Several oil agencies reduced their oil demand outlook, including the US Energy Information Administration (EIA), International Energy Agency (EIA) and even the OPEC itself. The EIA trimmed its oil demand growth forecast for next year to 880,000 barrels per day (bpd) from 1.12 million bpd previously; the IEA now expects an increase of 900,000 bpd rather than 1.1 million, while the OPEC envisages demand to increase by 1.12 million bpd in 2015. According to the OPEC’s own estimates, the call on the cartel has fallen to a 12-year low of 28.9 million bpd (this is the amount of oil needed to be produced by the OPEC to match the expected world demand with supply).
But the problem is that the OPEC is producing a lot more oil than is needed at the moment and may continue to exceed its agreed limit throughout 2015. The oil market is therefore expected to remain well supplied and that is why prices have been falling sharply of late. Causing prices to fall further was the publication of the weekly US oil data on Wednesday. The EIA’s report showed a 1.5 million barrel increase in crude oil inventories last week, which easily disappointed expectations of a 2.6 million barrel decrease. On top of this, distillate and gasoline stocks both increased surprisingly sharply, by 5.6 and 8.2 million barrels respectively.
In the week ahead, if oil inventories data show another sharp build, then expect WTI oil prices may continue their downward trajectory. Things could get even worse if the manufacturing PMI numbers also miss the forecasts (see the Global Data Highlights section below for details). As mentioned, WTI has now broken the psychological support at $60. Given that many similar supports have been broken in the past, this should not have come as a major surprise. Worryingly, there is now little support seen until the next major psychological level at $55 or even $50. At this stage it is extremely difficult to predict when oil prices may bottom out. For all we know oil could just easily turn around and stage a sharp rally any time now as prices are after all extremely oversold. Not that we need the RSI to tell us this, but this indicator is indeed at an extremely low level. Nevertheless, the extent and speed of the drop means prices could form a near term base soon.
Global Data Highlights
Monday, December 15, 2014
1:30 GMT Australian Mid-Year Economic and Fiscal Outlook Report
The MYEFO, as it’s called, is likely going to take a brunt of the early news attention from Asia as Treasurer Joe Hockey’s predictions of balanced budgets in the future may very well be reflected upon. According to a report from accounting firm Deloitte, budget deficits will get bigger thanks to a variety of factors including falling commodity prices. If Deloitte is correct in their assumptions, the deficit increasing by large amounts could weigh heavily on the AUD which has been taking a beating lately anyway, but could fall even further particularly if China doesn’t start showing stronger numbers as well.
Tuesday, December 16, 2014
1:45 GMT Chinese HSBC Preliminary Manufacturing PMI (December)
Speaking of China, the HSBC Preliminary Manufacturing PMI hasn’t encouraged too many investors that the Asian Giant is heading anywhere but down. The consensus expectation is that this figure will fall below the 50 level that demarcates growth from contraction meaning that Chinese manufacturers could be shrinking to prepare for a less robust economy. To be fair, this metric has fallen below 50 already in 2014 and stayed there for the first 5 months of the year only to recover above it since, but it has been declining since reaching a high of 52 in July. A return back below 50 could weigh heavily on AUD and NZD as the week progresses.
9:00 GMT Eurozone Preliminary Manufacturing, Services, and Composite PMI (December)
This data will be the first glimpse of Europe’s economy that we have for the new month, and the market is expecting it to be good news with the December composite survey expected to rise to 51.5 from 51.1. Watch out for regional variations, French and German surveys, released earlier, could be scrutinized if they come in on the weak side. Due to the sharp selloff in the EUR this year, the bigger risk to prices is from an upside surprise in this data.
9:30 GMT UK Inflation Data (November)
The focus is likely to be on the UK inflation figures, which could be a big driver of the pound this week. The market is expecting UK CPI to resume its downward trend, and the annual rate is expected to fall to 1.2% from 1.3%, which would reverse the slight uptick to prices in October. It is also worth watching producer prices, input prices are expected to decline at their fastest pace since 2009, which could keep consumer prices depressed for some time. Weaker price data is likely to weigh on the pound.
10:00 GMT German ZEW (December)
After declining in the second half of 2014, the market expects German investor confidence to stabilize in the final month of the year. Although it is likely to remain at a low level, the expectations index, which looks six months ahead, is expected to pick up sharply, suggesting that the future could be bright for Europe’s largest economy.
10:00 GMT Eurozone Trade Balance (October)
Europe’s trade surplus is expected to rise to EUR 18.4BN from EUR 17.7BN, this contrasts with the UK and the US who are both running deficits. Although a strong trade position can be currency positive, in the Eurozone the boost to the trade surplus is down to weakness in imports and a sluggish economy, which could limit any upside for the EUR.
13:30 GMT US Building Permits and Housing Starts (November)
The USD took to some profit-taking this past week after it had enjoyed a couple months of unfettered strength on the back of a never-ending stream of good US data. That USD weakness wasn’t triggered by bad news per se, so there may be no reason to assume that this is anything but a small respite in a larger climb. If Building Permits and Housing Starts were to show strength once again, as they did last month, the USD rise may resume its advance against the other currencies of the world.
Wednesday, December 17, 2014
9:30 GMT Bank of England Meeting Minutes
The BOE announced last week that it would change the way it releases the minutes from its meetings from August next year. Going forward they will be released on the same day as the meeting. Until then we have to wait two weeks to read what the MPC discussed in its meeting. These minutes are expected to show a continued 7-2 split, however the tone could lean towards the dovish side and there could be some concern about the fall in inflation. It will be interesting to hear the BOE’s thoughts on wage growth, which picked up in October.
9:30 GMT UK Labor Market Data (October/November)
The unemployment rate is expected to fall for another month to 5.9%, its lowest level since 2008. However, all eyes are likely to be on the wage growth data, as this is a key metric that is looked at by the BOE. The market expects another month of positive wage data for October, with wages ex-bonus expected to rise to 1.6%, up from 1.3% in September. If this happens, then wages could be significantly above inflation, which could be pound-positive.
13:30 GMT US Consumer Price Index (November)
Now that the US labor market has asserted its dominance with the most recent Non-Farm Payroll report, the Federal Reserve can pay much more attention to the inflationary side of their dual mandate. Not that they haven’t lately anyway, as inflation has become a hotter topic for central banks over the last year or so, but it has also taken a higher priority for traders as well. Consensus anticipates the MoM change to decline 0.1%, so if it can at least achieve break even, the prospects for an interest rate hike in the first quarter of 2015 could increase, leading to even more USD strength.
18:00 GMT Federal Open Market Committee’s Decision, Statement, Projections, & Press Conference
There isn’t much in the way of market breaking changes expected from this Fed meeting, but the release of the committee’s projections is always an interesting look in to the minds of central bankers. Fed Chairwoman Janet Yellen is likely to praise the labor market in her press conference, but likely will tow the same line that if things continue to improve, they will increase rates sooner than anticipated; and if they don’t improve, a rate increase will come later than anticipated. She likely won’t give any timelines despite the pleading of the press on hand, and we may expect to see the Fed sit on their hands for a few months as monetary fireworks in Europe appear set to be lit.
21:45 GMT New Zealand Gross Domestic Product (Q3)
Surprisingly, this past week the Reserve Bank of New Zealand did very little in attempting to jawbone the NZD lower like many market prognosticators anticipated. In fact, RBNZ President Graeme Wheeler’s introduction of the “some further increase in the OCR is expected to be required at a later stage” line was considered quite hawkish for the region that is struggling with freefalling milk prices. Does Wheeler know something the rest of us don’t? Considering his position, it is logical to assume so, which means that the milk price crisis isn’t really a crisis at all and perhaps the nation is taking it in stride. One way to find out is with the GDP which is expected to increase by 0.7%. If GDP increases by more than anticipated, Wheeler could have been relaying the message that milk isn’t the only thing that the Kiwis do well.
Thursday, December 18, 2014
9:00 GMT German IFO (December)
The market is expecting German industrial confidence to rise this month as the economy seems to be coming back after a weak patch earlier in the year. A positive surprise could boost the EUR as it would suggest that the Eurozone’s largest economy is back firing on all cylinders.
9:30 GMT UK Retail Sales (November)
Retail sales are expected to expand in November, although the pace of growth is expected to be half of October’s strong 0.8% monthly expansion. The market will be looking to see if Black Friday sales and a fall in the price of petrol have helped to boost consumption. Any positive data could be good news for sterling bulls.
Friday, December 19, 2014
TENTATIVE Bank of Japan Monetary Policy Statement and Press Conference
This BoJ meeting is the first to follow the General Election that is taking place on December 14th, and is unlikely to produce much. The impact of the increase in Quantitative and Qualitative Easing at the end of October hasn’t yet had an opportunity to be measured fully so the bank is unlikely to act too hastily, particularly so soon after the elections. However, there is a small risk that Prime Minister Shinzo Abe may suggest the bank do even more if his party gains even more footing in the legislation.
13:30 GMT Canadian Consumer Price Index (November)
Inflation (or lack of) in Canada hasn’t been as much of a concern as it has in many other developed nations, but the decline in oil prices could raise its ugly head in this report. Canada is highly dependent upon its exports of crude to the US and a decline in prices could also drag on inflation, making the Bank of Canada’s job a little more interesting. On the flip side though, housing prices have been on the rise and has been feared to be a bubble, so a fall in inflation may not be such a terrible thing for that particular industry.
Enjoy this newsletter? Use the share button to post it on your favorite site or subscribe to our RSS feed to receive session recaps daily.
