Technical Developments to Watch:
- EUR/USD downtrend intact below resistance at 1.1100
- GBP/USD consolidating just below near-term resistance at 1.5675
- USD/JPY keeps getting rejected by “Kuroda Line” near 124.50
- AUD/NZD in play, key Fib support sits at 1.0890 heading into a data-heavy week
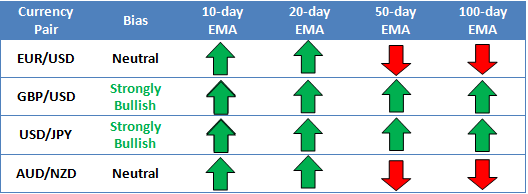
* Bias determined by the relationship between price and various EMAs. The following system determines bias (numbers represent how many EMAs the price closed the week above): 0 = Strongly Bearish, 1 = Slightly Bearish, 2 = Neutral, 3 = Slightly Bullish, 4 = Strongly Bullish.
** All data and comments in this report as of Friday afternoon **
EUR/USD

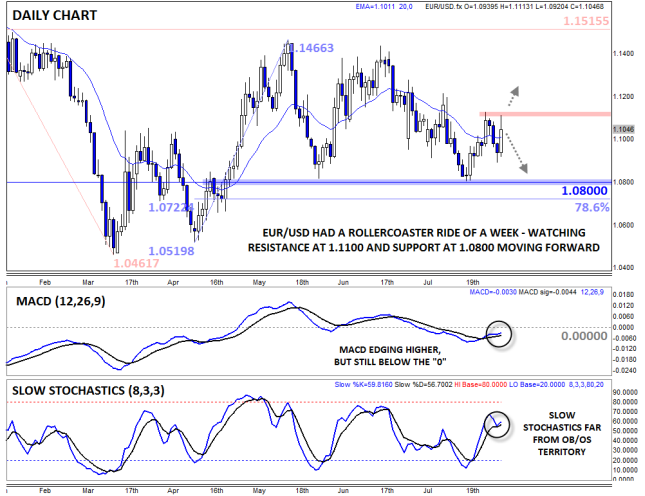
- EUR/USD spiked up to 1.1100, pulled back, then ran back to that level as of writing
- MACD edging higher, but still below the “0” level
- All eyes on key previous resistance near at 1.1100
EUR/USD spiked up to 1.1100 on Monday before rolling over and dipping below 1.0900 on Thursday on worries about political turmoil in Greece and generally strong US data. The pair did its second about-face on Friday, turning back higher on weak US wage data. As for the secondary indicators, they’re generally neutral, with the MACD edging back up toward the “0” level and the Slow Stochastics solidly in the middle of its range. As we move into a new trading week, all eyes will be on previous resistance at 1.1100.
Source: FOREX.com
GBP/USD

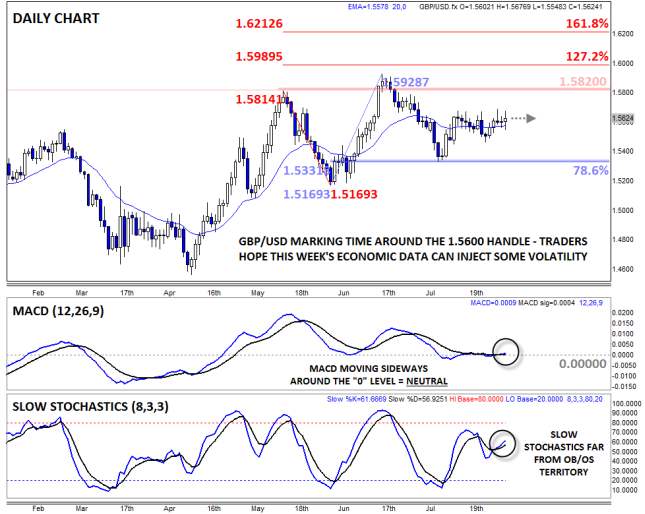
- GBP/USD still holding around the 1.5600 level
- MACD and Slow Stochastics show balanced, two-way trade
- Key near-term resistance still looms at 1.5675
GBPUSD edged higher within its near-term range early last week, testing resistance at 1.5675 before turning back lower on Wednesday. With both the MACD and Slow Stochastics in neutral territory, traders may opt to adopt a neutral bias heading into the new trading week and react to the price action and news announcements, including Friday’s highly-anticipated NFP report, as they come.
Source: FOREX.com
USD/JPY

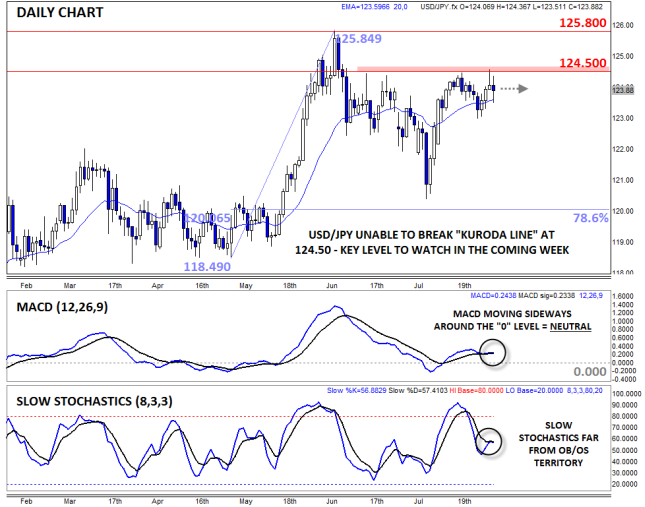
- USD/JPY re-tested previous resistance at 124.50 last week, but was unable to break that barrier
- MACD and Slow Stochastics show balanced, two-way trade
- All eyes on the “Kuroda Line” in the 124.50-125.50 zone
USDJPY traded generally higher last week, spiking up to test the “Kuroda Line” at 124.50 on Thursday before turning lower on the back of weak US wage data as of writing on Friday. The pair remains firmly capped by the so-called “Kuroda Line” in the 124.50-125.50 zone, where the market fears more verbal or actual intervention from the BOJ. Meanwhile, the MACD and Slow Stochastics are showing balanced, two way trade, so we’ll have to see if this week’s economic data can push the pair above the resistance zone around 125.00.
Source: FOREX.com
AUD/NZD

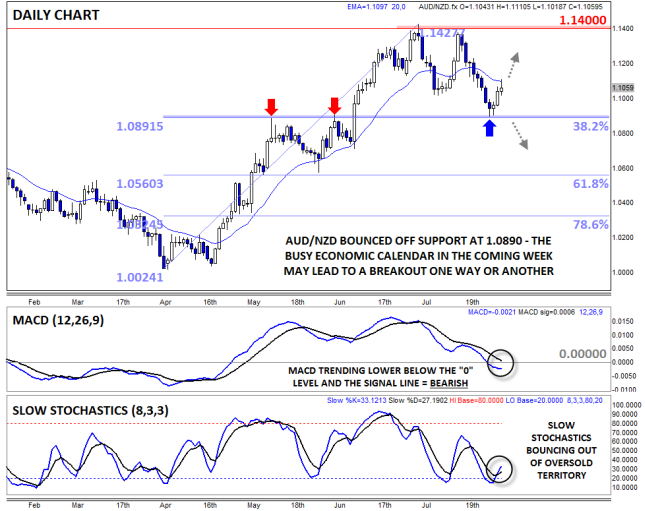
- AUD/NZD bounced off 38.2% Fibonacci support near 1.09 last week
- Slow Stochastics turning higher from oversold territory
- Traders will watch support at 1.0890 and resistance up at 1.1100 this week
AUD/NZD is our currency pair in play this week due to a number of high-impact economic reports out of Australia and New Zealand in the coming week (see “Data Highlights” below for more). The pair turned higher off 38.2% Fibonacci support at 1.0890 last week, though the rally has lost of some its steam as of writing on Friday. Meanwhile, the MACD recently crossed below the “0” level, signaling a shift to bearish momentum, while the Slow Stochastics have bounced out of oversold territory. For this week, the key levels to watch will be support at 1.0890 and resistance at the 20-day MA around 1.1100.
Source: FOREX.com
The Fed: Why Economists and the Market do not Agree on a Rate Rise
As we start a new week the focus shifts to the US labor market report scheduled for release on Friday. Another solid reading of 200k + could trigger even more chatter about the prospect of a Fed rate rise, potentially as early as September, after the latest FOMC statement said that a strengthening labor market makes a rate hike more likely this year.
The interesting thing is that although economists might be saying that a rate hike could come as early as September, they are not putting their money where their mouths are. The Fed Funds Futures rate for September, a good proxy for US interest rate expectations, is not looking for a hike in September with only 17 basis points of hikes currently priced in. 30 basis points are priced in for December, which is equal to one hike by the end of this year.
Why are markets so cautious about a rate hike in September? We think traders are unwilling to price in an “aggressive” Fed stance this autumn for a few reasons including:
- The Fed has made it clear that it will only hike rates if the economic data remains strong. The patchy nature of the US’s economic recovery in recent years has made investors back off from expecting too much from the US economy.
- For example, the US employment cost index sunk to its lowest level since 1982, rising only 0.2% in Q2, suggesting that there still remains very little inflation in the US labour market.
- The Fed has not been tied to committing to the timing of any rate rise.
- The Fed has said that this “rate hiking” cycle will be shorter than in the past, which gives it more flexibility on the timing of the first rate rise.
As you can see, although the Fed is moving in the direction of a rate hike, the caveats are huge, which may keep investors on the side-lines when it comes to actually trading on the timing of the first rate hike.
This does not mean that investor caution will disrupt a dollar rally. The dollar could still rally based on relative interest rate expectations elsewhere. The perfect example is the EUR. The ECB is in the middle of a QE program and is expected to keep an accommodative monetary stance for some time. Thus, the EUR could remain under pressure, especially vs. the USD, even if the Fed waits until December to hike rates.
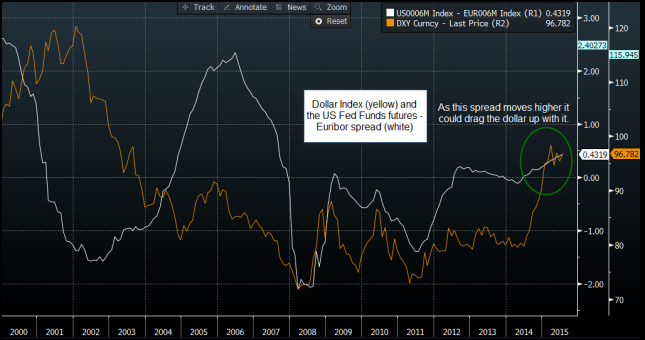
The chart below shows the 6-month Fed Funds Futures and Euribor (a good proxy for Eurozone interest rates) spread, which is moving firmly in the dollar’s favour. As the spread widens – expectations for US interest rates climbs higher than for European interest rates – the dollar index tends to rally. As a side note, the dollar index measures the dollar’s performance vs. its major trading partners, and the EUR makes up more than 50% of this index.
As you can see, this spread is at its highest level since 2007, if it can continue to move back into pre-financial crisis territory then we could see further dollar strength in the coming weeks. We think this could be particularly noticeable vs. the EUR. If the Greek crisis blows up once again (see more below), then Friday’s EUR/USD rally back to 1.11 could be snuffed out at the start of this week and a move back to 1.0800 support may be on the cards.
Source: FOREX.com, Data: Bloomberg
Watch Out for the Second Greek Referendum
In recent weeks the Greek crisis has receded into the distance, other concerns such as the volatility in the Chinese stock market and the timing of a potential first rate hike from the Federal Reserve have taken center stage and the dominated market action.
Understandably, once it looked like Greece would be able to secure a third bailout and accept its creditors conditions the markets started to look elsewhere for market-moving events. However, now the spectre of more Greek woe is upon us once again as a political split within the Syriza party threatens to throw Athens’ third bailout into disarray.
The latest news from Greece makes grim reading:
- PM Tsipras is coming under attack from the “radical” element within his party for agreeing to conditions in return for more bailout cash.
- The new bad boy in Greek politics, Panagiotis Lafazanis, is leading the Syriza stance against Tsipras. He is leading up a faction within Syriza called Left Platform – the new thorn in Angela Merkel’s side.
- A meeting scheduled by Tsipras to address Syriza’s central committee on Thursday, ended in chaos with Tsipras eventually calling a referendum of Syriza party members on Greece’s latest bailout agreement.
Another referendum:
Oh yes, a month on from the last one, Greece is holding another referendum on Sunday 2nd August. This is only for the Syriza Party, and won’t hold the same weight as the national referendum, however it is asking the same question: a yes-no vote on the latest EUR 86bn bailout.
Even though this is not a national bailout, if Tsipras loses the referendum and the support of his party it could lead to a political meltdown, with the Syriza party losing its parliamentary majority, Tsipras stepping down as PM, and fresh elections being called. If this happens then the entire 3rd bailout would be unlikely to go ahead, leaving Greece at risk of further defaults in the coming days and weeks. It’s hard to tell what it would mean for Greece’s EU bridging loan, which is currently the only financial support Athens receives. If Greece’s creditors pull the plug on the bridging loan then it’s hard to see how Greece can avoid a Grexit in the coming months.
Grexit risks never too far away
As you can see, Greece is definitely not out of the woods yet and its financial future is still not secure, which is why we will watch the outcome of this Sunday’s referendum closely. If Tsipras loses the vote and Syriza votes No to the bailout, then it could mean a few things for the financial markets including:
- Excess volatility in global financial markets in the coming weeks. Combined with recent volatility in Chinese markets, it could make August a rough-ride for investors.
- Will the Fed hike interest rates if a Grexit is on the cards? We think not and it could eradicate the prospect of a rate hike from the Fed or the BoE for the whole of 2015.
- Europe would be at risk of another recession, especially if peripheral bond yields start to rise.
- The EUR could come under sustained attack if a Grexit makes the ECB commit to extending its QE programme.
Overall, the risk from an adverse outcome to this referendum is higher levels of stock market volatility, which, outside of Asia, has receded in recent weeks. It could also trigger a prolonged downturn in the EUR. The single currency was suspiciously resilient during the peak of the Greek crisis in June and early July, however, the downfall of the Tsipras government could be the canary in the coal mine, and finally tip EDURUSD over the edge. 1.0850 has held as solid support since May, a break below here opens the way to 1.0500 – 2015 lows – then potentially to parity.
Conclusion:
Who would have thought that Tsipras would turn out to be a pragmatic politician, but that is the way it is looking. He has lambasted party members who don’t agree with the bailout, saying that they do not appreciate the perilous situation that Greece finds itself in. The very fact he had to call a referendum is a sign that investors should not lose sight of Greek risks, even when the focus is on China and the timing of a US rate hike.
If Syriza votes No to the bailout on Sunday, it could make for a very volatile first trading session in August.
Look Ahead: Stocks
S&P 500
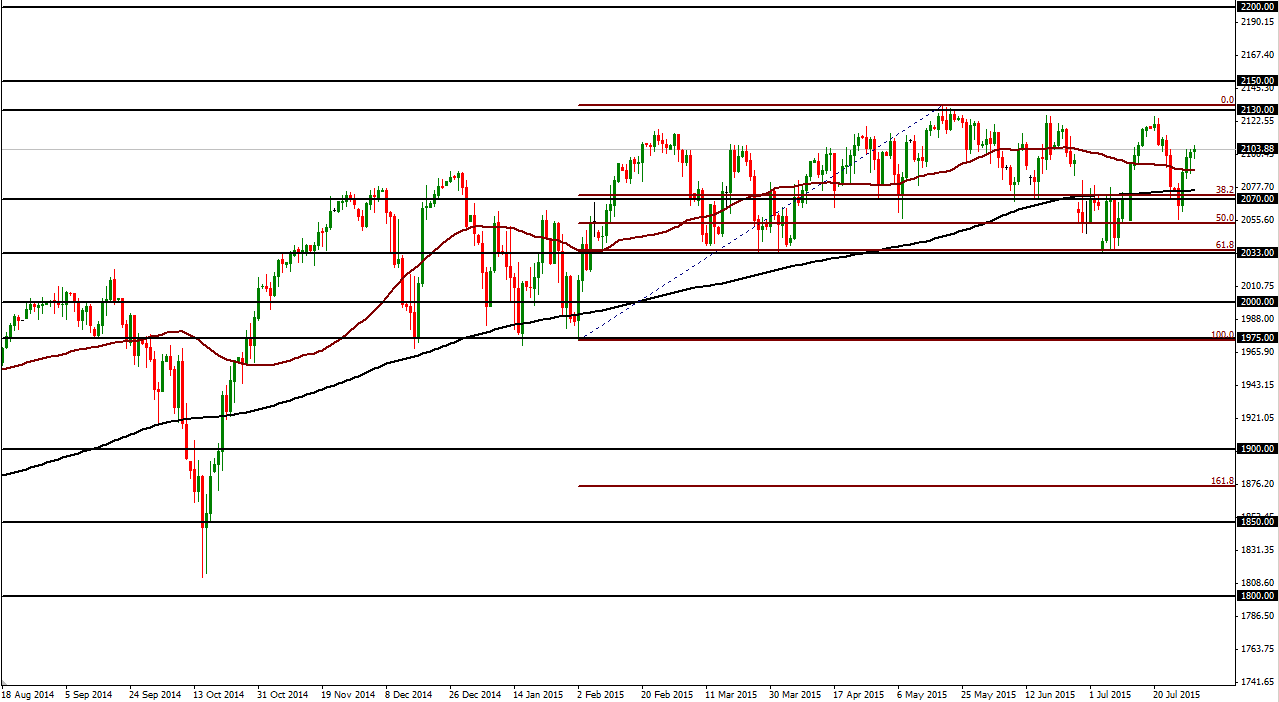
The S&P 500 gained significantly this past week after having dropped down to hit a two-week low of 2056 in the beginning of the week. This gain reverses some of the losses from the prior week, when the index tumbled from near its record high. The current heights of the index have been maintained despite widespread speculation regarding a 2015 rate hike, which could put a damper on the equity markets, as well as a mixed bag of major earnings releases. Having risen back above both its 200-day and 50-day moving averages, the S&P 500 appears to be attempting yet another run at May’s all-time high of 2134. Two prior attempts, in June and earlier in July, were both thwarted just shy of that target before sharp drops occurred. Downside risk continues to be a major concern for the S&P 500, as China’s market turmoil remains a significant and volatile threat. With any break back down below the 200-day moving average, the index could quickly fall into an extended pullback, with the first key downside target at the solid support base around 2035, which last supported the index in early July. On any breakdown below that base, an extended pullback could then drop down towards further key support around the 1975 level. To the upside, in the event of a successful breakout above the noted 2134 record high, the next major target in uncharted territory is the 2200 level, which is around the 161.8% Fibonacci extension of the most recent major pullback from the all-time high down to the 2035-area base.
Source: FOREX.com. Please note this product is not available to US clients
DAX
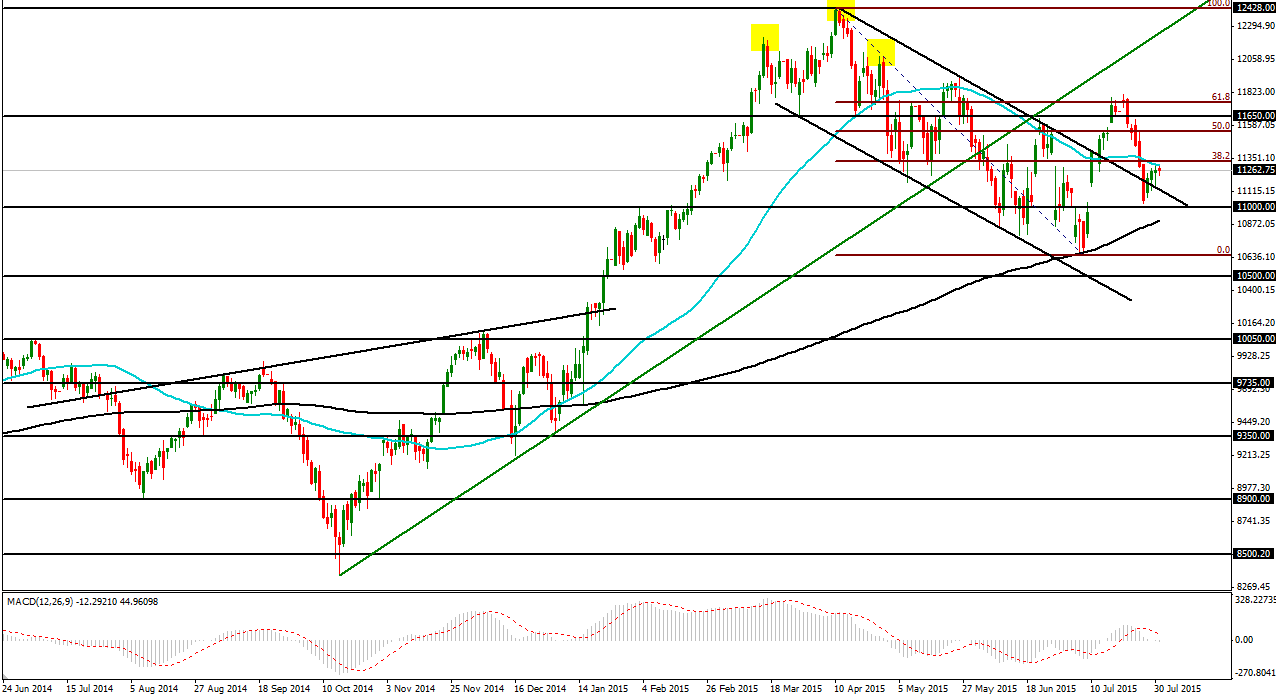
Although the DAX showed signs this past week of a recovery attempt from the sharp plunge of the prior week, the German index lagged well behind the performance of its US and UK counterparts. The nosedive found a tentative bottom early in the week just above the 11000 psychological support level before rebounding modestly. This drop briefly placed the DAX back down within the borders of a large descending trend channel that extended back to April’s all-time high of 12390. That descending channel was previously broken to the upside in mid-July, after which the index went on to hit a high around 11805 before making the noted plunge. That high also happened to be around the 61.8% Fibonacci retracement of the recent 14% correction from April’s 12390 record high down to July’s low point around 10650. Like the S&P 500, the DAX continues to carry significant downside risk, especially if it remains trading under its 50-day moving average. Any breakdown below the noted 11000 support level could then target July’s low point around 10650. From a longer-term perspective, the longstanding trend continues to point to the upside. On any sustained trading back above the 50-day moving average, upside targets remain around 11800 and the 12000 psychological level.
Source: FOREX.com. Please note this product is not available to US clients
Look Ahead: Commodities
Gold
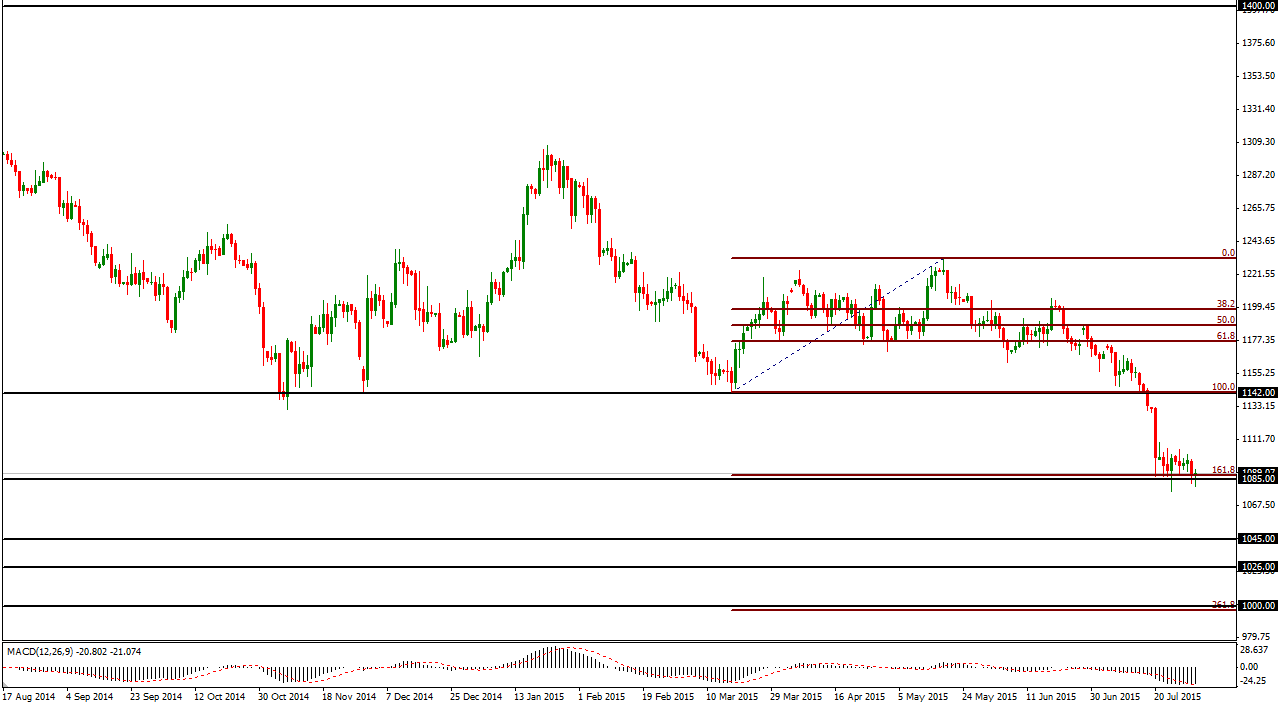
The price of gold has remained in a relatively tight trading range for the past two weeks after a rapid selling frenzy caused a dramatic plunge below $1100 to hit a new five-year low. Prior to that drop, gold had already broken down below its previous support level around the 1142 price region, which had served as key support in November of last year and March of this year. That breakdown confirmed a continuation of the longstanding downtrend in gold that has essentially been in place since late 2011. After that plunge, the precious metal regained some measure of stability, but briefly spiked down to touch a new low around $1077 before bouncing. Currently in a continued consolidation above that low and just below $1100, gold’s short-term direction should be significantly influenced by the timing and magnitude of future Fed rate hikes, and the resulting fluctuations of the US dollar. While the price of gold is significantly oversold from a technical perspective, and a rebound to correct the recent over-extension to the downside should be due, the possibility of a relief rally will be largely dependent upon shifting speculation with regard to upcoming Fed statements and decisions. Despite the new five-year intraday low being around the noted $1077 level, key support actually resides around $1085, which served as support back in 2010. This level also stands as the 161.8% Fibonacci extension of gold’s latest rebound from this past March to May. If this key support is unable to hold, a sustained breakdown could send the price of gold tumbling down to the next major support levels at 1045 and then 1000, which is both an important psychological level as well as the 261.8% Fibonacci extension of the noted rebound earlier this year. Any significant rebound from current support should be limited to the upside by the noted 1142 prior support level, which may now be considered a major resistance level.
Source: FOREX.com. Please note this product is not available to US clients
Global Data Highlights
Monday, August 3
0145GMT – China Caixin Final Manufacturing PMI (July)
After a surprisingly large drop in the flash figure for July to 48.2, the market began to question the health of China’s manufacturing sector. This time around the market is expecting a slight improvement in the final figure to 48.3, although this is still deep in contraction territory. If sentiment deteriorates even further in July it may shake already fragile investor sentiment in Asia, hurting the region’s two main commodity currencies, the AUD and NZD.
0830GMT – UK Markit Manufacturing PMI (July)
Manufacturers have been feeling the pressure from a stronger pound lately, thus we want to see how this is affecting sentiment within the sector. In June, the index remained in expansion territory at 51.4, but it has been broadly drifting lower since peaking in 2013. This time around the market appears to be looking for a slight improvement to 51.6.
1400GMT – US ISM Manufacturing PMI (July)
After stalling in early spring this Index has recovered, leading some to suggest that the manufacturing sector is over its winter hump. The big exception to this is parts of the sector that have had to cut orders of equipment and manufacturing due to deteriorating oil prices. This time around the market is expecting the Index to remain stable during July at 53.5.
Tuesday, August 4
0130GMT – Australian retail sales and trade balance (June)
This data may take a backseat to the results of a monetary policy meeting at the RBA later in the day, but they may still have an impact on the aussie; the strength of trade exposed sectors and the pace of activity at the ground level in Australia are important ingredients in the RBA’s policy mix. Retail sales are expected to have jumped a somewhat encouraging 0.4% and the deficit is expected to widen slightly to 2.95bn in June.
0430GMT – RBA Policy Meeting
The Reserve Bank of Australia (RBA) is widely expected to leave the official cash rate at 2.00% this time around. However, there’re some in the market who think the RBA needs to cut the official cash rate further in coming months. Overnight index swap rates suggest that at the time of writing there’s around a 20% chance that the RBA will loosen monetary policy this time around, which is fairly low. Instead, it’ll be worth watching the Stevens’ accompanying statement for possible hints that the bank’s softening its bearish stance on the exchange rate or subtly changing its implicit dovish bias.
Tentative – NZ GDT Price Index
This index has become a very important release for the kiwi, as it provides an uncut look at the behaviour of dairy prices, which are NZ’s biggest export, at the ground level. Prices have dropped at the last nine auctions, including a massive 10.7% fall at the last auction in mid-July, thus another weak result could hit the kiwi hard, while a push into positive territory may calm some kiwi bears.
2245GMT – NZ employment numbers (Q2)
This release will be closely watched after Q1’s fairly dismal employment report, which added to the RBNZ’s case for looser monetary policy. This time around the market is expecting the unemployment rate to increase to 5.9% from 5.8%, with employment and wages both anticipated to increase 0.5% q/q. With the market already looking for a somewhat downbeat report, an even worse than expected set of numbers could really hurt the kiwi as it would increase the chance for further policy loosening from the RBNZ.
Wednesday, August 5
1215GMT – US ADP Non-farm employment (July)
The ADP non-farm gauge of private sector employment in the US is widely used as a key input in headline NFP expectations. In saying that, a stronger than expected ADP number for June didn’t prevent the associated headline NFP number from missing expectations. Nonetheless, it will be very closely watched by market commentators trying to decipher when the FOMC will begin hiking interest rates; this time around the market is expecting around a 210K increase.
1230GMT – US trade figures (June)
The health of trade exposed sector of the US economy is another important part of the Fed’s policy making process, especially given some recent strength in the US dollar and the negative effect this is having on exporters. While the export sector doesn’t make up a large proportion of the US economy, a lot of companies are indirectly exposed to it. We are expecting the trade deficit to have widened slightly in June to $42.25bn from $41.87bn.
Thursday, 6 August
0130GMT – Australian employment report (July)
Australia’s labour market is being closely watched by the RBA as it’s a vulnerable part of the Australian economy. So far, slowing immigration has helped keep the unemployment rate at around 6.0%, backed-up by encouraging increases in full-time employment. This time around we’re expecting the unemployment rate to rise to 6.1%, underpinned by only a 10K increase in jobs and a stable participation rate of 64.8%. There a few things to watch with this report: whether jobs lost/added are part-time or full-time, with growth in the latter seen as the healthier option; whether or not people are entering or leaving the workforce, judged by the jobs total and the participation rate.
1100GMT – BOE and MPC
The market is jostling with the possibility of the BOE hiking interest rates before the Fed, or at least just after the world’s first central bank. At present the BOE is expected to begin hiking interest rates in January, just one month after the Fed is expected to begin tighten monetary policy. The inflation report that will be released with this meeting is going to be closely watched by the market for any signs that the bank may hike sooner than expected, given recent improvements in the labour market. However, inflation still remains stagnant and could even become deflation in the near-term, which means the BOE must remain cautious.
1230GMT – Unemployment claims (August 1)
Initial jobless claims are a key input into the NFP crystal ball, thus the numbers can have a significant impact on the US dollar, especially if they beat/miss expectations by a large amount. There are no market predictions at the time of writing, but we suspect market hopes are hovering around the prior figure of 267K.
Friday, 7 August
0130GMT – RBA Statement on Monetary Policy
The RBA only releases this statement once a quarter and they are very in-depth, which means they provide a clearer picture of the RBA’s outlook for interest rates and the economy than its post-meeting statements. The market may be looking for clarification of the RBA’s implicit dovish bias, while also keeping an eye on prospects for growth and inflation.
Tentative – BOJ
The Bank of Japan’s meetings of late have largely been non-events for the market, and we aren’t expecting much to change this time around. Some members of the board have recently expressed concerns about the negative impacts of leaving stimulus in the economy for too long. Other members of the bank are leaning more towards introducing further stimulus, but we don’t think it’s going to happen this time around.
1230GMT – US NFP
Last but not least, the US is due to release its all-important non-farm payrolls and other employment numbers for July. The health of the US labour market is a major factor in the setting of monetary policy, thus it’s very closely watched by the market and the Fed alike. Successive strong employment reports are the backbone of the Fed’s case for tighter monetary policy this year and will help determine when the bank begins hiking interest rates. This time around the market appears to be expecting a headline NFP figure of 225K, the unemployment rate to remain at 5.3% and average hourly earnings to increase 2.0% m/m.
