Market Movers: Weekly Technical Outlook
Technical Developments to Watch:
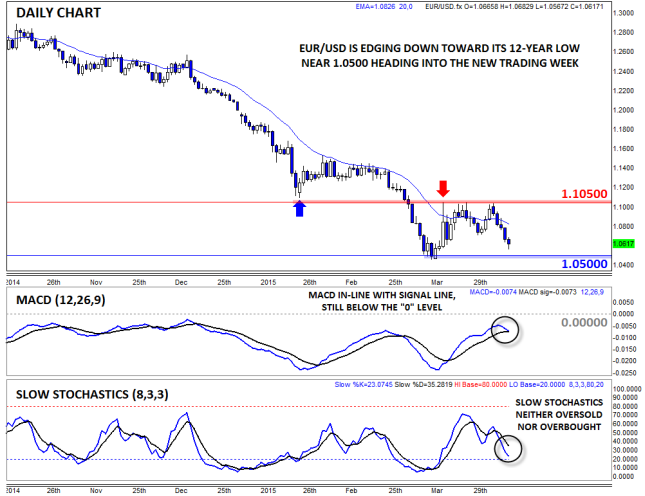
- EUR/USD edging down toward key support near 1.0500
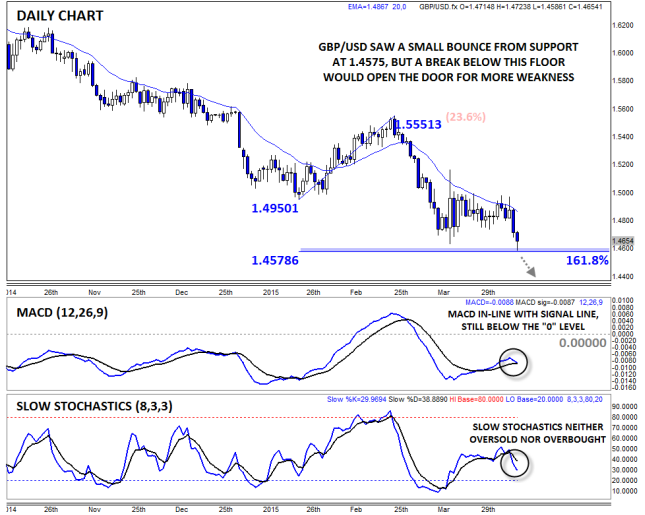
- GBP/USD at a fresh 4-year low, key support at 1.4575
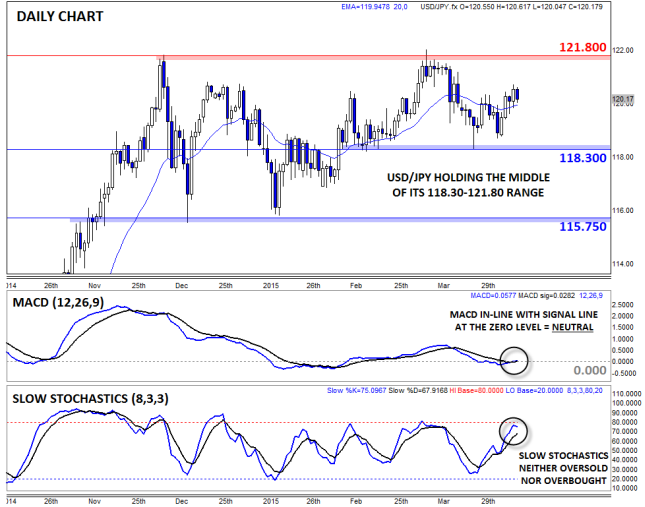
- USD/JPY still consolidating in 118.30-121.80 range
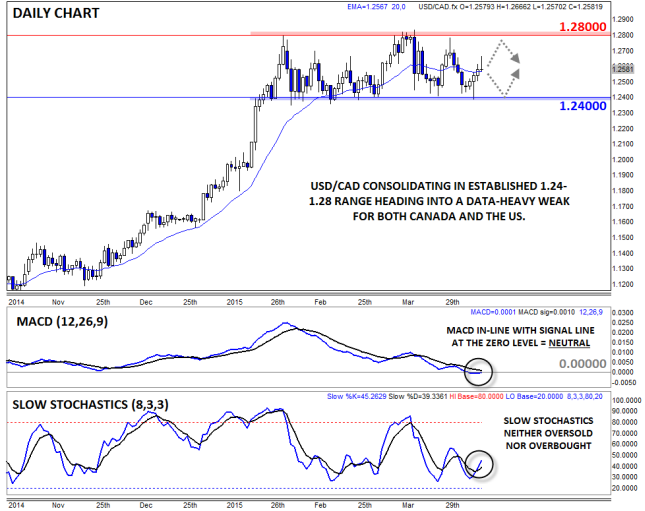
- USD/CAD in play – key support at 1.24, with resistance up at 1.28

* Bias determined by the relationship between price and various EMAs. The following hierarchy determines bias (numbers represent how many EMAs the price closed the week above): 0 – Strongly Bearish, 1 – Slightly Bearish, 2 – Neutral, 3 – Slightly Bullish, 4 – Strongly Bullish.
** All data and comments in this report as of Friday’s European session close **
EUR/USD

- EUR/USD sold off from the top of its range at 1.1050 last week
- MACD and Slow Stochastics show balanced, two-way trade
- Bias neutral within established 1.0500-1.1050 range
EUR/USD faded consistently throughout last week’s trade, dropping from resistance at 1.1050 to test the bottom of its recent 500-pip range near 1.0600 as of writing on Friday. As you would expect after the generally sideways price action over the last few weeks, the MACD and Slow Stochastics are indicating balanced, two-way trade. Moving forward, traders may look to fade an initial dip toward 1.0500 support, though if that level gives way, it could herald the beginning of the next leg lower.
GBP/USD

- GBP/USD consolidated early last week before dropping sharply on Thursday and Friday
- MACD and RSI showing balanced, two-way trade
- Next support is the 161.8% Fibonacci extension at 1.4580
GBP/USD was very choppy over the beginning of last week, but traders finally picked a direction Thursday, driving the pair down to 1.4600 by Friday morning’s trade. From a broader perspective, more weakness will be favored as long as previous long-term support in the 1.48-1.50 zone holds as resistance. Meanwhile, the 161.8% Fibonacci extension of the Q1 bounce at 1.4580 could provide some support this week, but a break of that floor could quickly expose 1.4500 or lower.
USD/JPY

- USD/JPY edged higher last week, but is still in the middle of its 118.30-121.80 range
- MACD and Slow Stochastics show balanced, two-way trade
- Resistance at the 7.5-year high (121.80) still looms over the pair
USD/JPY remains trapped in a sideways range, in its case between support at 118.30 and resistance up at 121.80. On a relative basis, the yen was able to withstand the dollar’s strength better than some of its major rivals, but it’s difficult to be constructive on any currency against the USD at this point. Heading into the new trading week, rates have regained the 120.00 level and are edging up toward the top of the well-trodden range. With neither the MACD nor the Slow Stochastics offering a clear signal, more consolidation may well be the name of the game this week.
USD/CAD

- USD/CAD tested the support at 1.2400 before bouncing on Wednesday
- MACD and Slow Stochastics show balanced, two-way trade
- Established 1.24-1.28 range remains as strong as ever
USD/CAD is our currency pair in play this week due to a number of high-impact economic reports out of both the US and Canada (see “Data Highlights” below for more). Last week, USD/CAD dipped to the bottom of its 1.24-1.28 range before recovering strongly on Wednesday. Not surprisingly, both the MACD and Slow Stochastics are relatively neutral, underscoring the balanced, two-way trade in the market. With rates almost directly in the middle of the 10-week range at 1.2600, traders may want to wait for a move toward the edge of the range before committing to strongly in either direction.
UK Election Fears Start to Make Investors Nervous
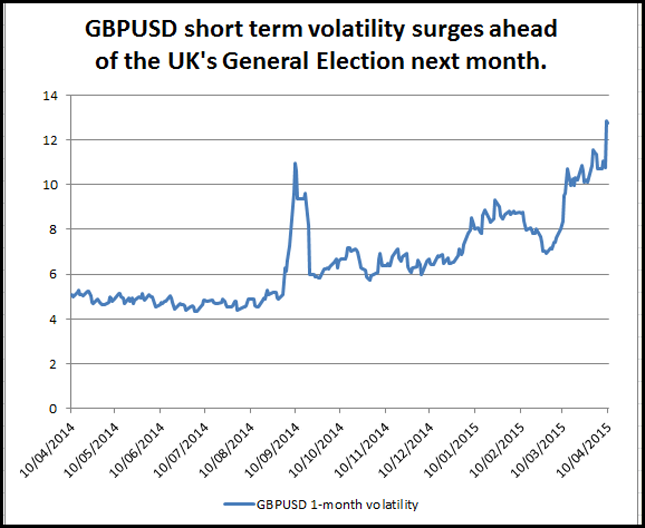
Last week may be remembered as the week when financial markets finally woke up to UK election risks. Short-term volatility surged in the pound and GBP/USD fell to its lowest level since June 2010, just after the last election.
As you can see in the first graph below, short-term volatility (1-month option volatility) rose to 13%, its highest level since 2011. At the last election in 2010, volatility surged to nearly 18% and GBP/USD was trading around 1.44. However, this time around the outcome is considered even more uncertain than in 2010 as there is a proliferation of smaller parties, making a hung parliament more likely. There are also issues around the UK’s deficit and its position within the EU that could trigger even more volatility this time around and weigh further on the pound.
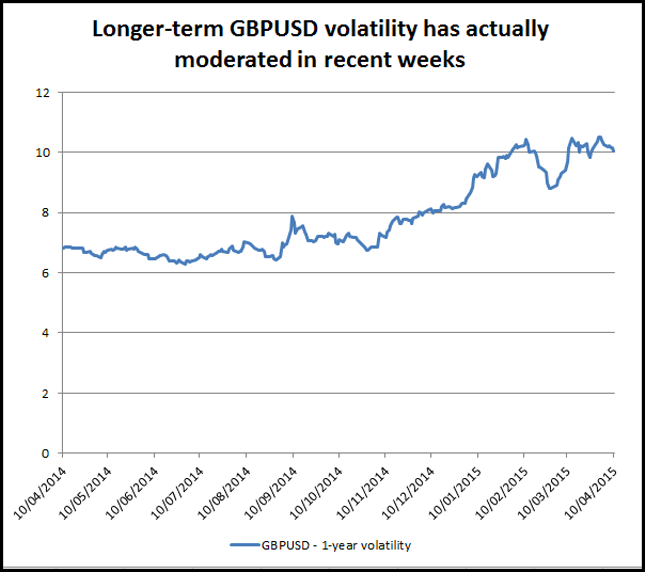
The election appears to be the key driver weighing on the pound right now. Below, you can see that GBP/USD volatility for 1-year has actually moderated in recent weeks, as some traders may think that UK political risk will recede by then.
While the election may be the main driver of GBP weakness, there are other factors that have caused GBP/USD to lose 6% so far this year. Economic data has surprised to the downside in recent weeks, and the Bank of England looks like it will hold off from hiking rates anytime soon as inflation is expected to remain weak when it is released later this week. Production data has also been a disappointment along with trade data, which suggests that the UK’s manufacturers have not been able to capitalize on the weakness in the pound in the last nine months. These are some of the reasons why the BOE kept rates on hold for the duration of the last Parliament.
Looking forward, the pound could come under further pressure after breaking key support on Friday at 1.4636 – the low from March. After breaking to a fresh 5-year low, the pound could see back to 1.45 in the coming days, particularly if inflation is weak. If, as we lead up to Election Day, we see the chances for a hung parliament rise, then we could see back to 1.4231—the low from May 20th 2010.
Interestingly, political uncertainty has not hurt the FTSE 100, which surged to a fresh record high on Friday, and even UK Gilts have continued to rise as investors continue to buy UK debt. During the Scottish referendum last September we saw the bulk of risk aversion in the FX market while stocks and bonds were fairly unscathed. However, if UK election risks mount and if the UK’s position in the EU is threatened, then we could see the FTSE 100 start to come under pressure since it is at such elevated levels. However, with a flurry of M&A activity in recent days, the FTSE 100 may be able to shrug off election fears until nearer to the actual election on May 7th.
Rubble: Putin in a Good Performance for 2015
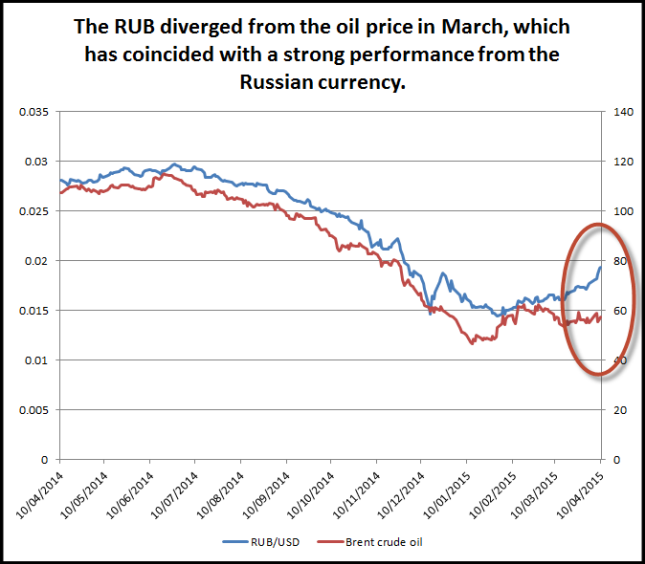
While the dollar makes headway against the EUR and the pound, its performance has been more muted in recent days and weeks against the emerging currencies. The buck has lost nearly 25% of its value versus the Russian ruble since the end of January, and RUB is the best-performing currency against the USD so far this year. The Indian rupee, Taiwanese dollar and Swiss franc are the other top performers that have made only a fraction of gains versus the USD compared to the RUB.
So what is driving the Russian currency?
- Yield: The Russian central bank made emergency rate hikes in December pushing yields up to 17%. Although rates have since been cut to 14%, the Rub still has a yield advantage. In an environment where European countries can sell debt at a negative yield, this pushes investors towards riskier, higher-yielding assets like the RUB.
- FX focus: Right now the FX market is focusing on weakness in the EUR and the GBP, which may allow EM currencies to fly under the radar.
- The fear factor recedes: The market is less scared about a potential Russian default, the oil price has stabilized (albeit at a low level) and the cost to insure Russian debt against default has fallen to its lowest level since early December.
- Relations with the West: Although not perfect, relations with the West have not deteriorated further. If Russia’s relationship with Greece continues to go from strength to strength then we could see pressure build on the EU to remove Russian sanctions altogether.
- Market dynamics: Some say that international investors have started to close out of their USD/RUB longs from the second half of last year, which is adding to the upward pressure on the RUB.
The one thing that the market is not focusing on is the economy. Russian GDP was 0.4% in 2014, and is expected to contract this year and next; however, that is not impacting the FX market. There were a lot of people not expecting the RUB to get this far, so where could it go next?
The Russian “miracle” could have further to run if the Ruble remains immune to any oil price declines (see chart) and if things in the Ukraine remain stable. As we mention above, the “yield effect” may continue to be a powerful driver of RUB appreciation going forward. If the oil price starts to recover later this year then this could add fuel to the RUB fire.
However, don’t expect the RUB to continue to appreciate in a straight line. Market dynamics won’t be on the RUB’s side forever, and we expect that to be less of a factor going forward.
Sunday, April 12, 2015
23:50 GMT Bank of Japan Monetary Policy Meeting Minutes
This will be the release of minutes for the meeting that took place before the last meeting of the BoJ, so it may be a little stale. On the other hand, there are some interesting dynamics going on behind the scenes at the BoJ that could be brought to light a little more with these minutes. In the most recent BoJ decision, there was one member who opposed the policy action, and he actually wanted to decrease the amount of asset purchases from ¥80 trillion per month down to ¥45 trillion per month. That’s quite a significant difference, and he was likely voicing this opinion well before dissenting this last time around. If there are multiple members who were considering cutting the amount of asset purchases, that could be a bullish sign for the JPY.
Monday, April 13, 2015
No significant news events
Tuesday, April 14, 2015
8:30 GMT UK Consumer Price Index (March)
There is a fear in the UK that inflation has turned to deflation of late, but low energy prices are clouding that determination. On one hand, low energy prices have a stimulatory effect, but that doesn’t seem to be showing in the other economic metrics in the UK, leading to the brutal decline in the Pound Sterling over the last few months. Adding on to the mere importance of inflation, UK elections are upcoming with no party really staking out a majority, and if economic figures aren’t showing positive signs, the current leadership may lose even more support. Unfortunately for the GBP, uncertainty drives contempt in currencies, so a low reading here could drive the GBP even lower than it is currently.
12:30 GMT US Retail Sales (March)
For three straight months the US has not shown any growth in Retail Sales, and in fact has actually declined for all of those months. If belief in the US recovery is to gain any traction, this metric will have to improve. The strange thing about it is that Consumer Confidence, which usually has a decent correlation with sales, appears to be surging. Therefore, this may be the month that we get a really surprising positive number and consensus may be buying in that notion with a 1.1% expectation. Historically speaking, we haven’t seen a number that positive since the April 2014 release, so perhaps history will repeat itself this month. If that is the case, watch for even more USD strength to come of it.
Wednesday, April 15, 2015
2:00 GMT Chinese Gross Domestic Product (Q1)
It feels like the world has been predicting a Chinese economic collapse for years now as warnings of both hard and soft landings have been discussed ad nausea, but it still hasn’t come to fruition. Chinese growth is still a runaway freight train at over 7.0% per annum, a figure that the rest of the world would rejoice in achieving. Regardless, if this GDP figure were to fall below that 7% red line, the Chinese bear spotters would come out in droves once again and tangential currencies could suffer as a result. However, if it stays above 7%, the AUD and NZD may enjoy some welcome relief.
11:45 GMT European Central Bank Monetary Policy Decision, Statement, and Press Conference
There isn’t really much more that the ECB can do to monetary policy considering they are in the midst of their Quantitative Easing program. Sure they could cut interest rates even more in to negative territory, but that may only quicken the pace for the EUR/USD to reach the parity level. Even if there isn’t much more he can say about the current situation, ECB President Mario Draghi has a flair for the dramatic, so if he points out a bunch of optimistic signs, the EUR may be ripe for a relief rally in kind.
Tentative Global Dairy Trade Price Index
The last two releases of GDT Price Index have been pretty brutal. The dual declines of 8.8% and 10.8% were the worst back to back results since the end of 2008 when this report was released monthly instead of bi-monthly. Much of the decline can be attributed to a decline in Chinese purchases of infant formula out of New Zealand on concerns of safety. If that bottleneck in demand continues, we may see another decline in this measure, which would be bad for the NZD.
14:00 GMT Bank of Canada Interest Rate Decision, Statement, Report, and Press Conference
The employment report out of Canada this past week was a mixed bag of tricks that looked positive, but had some warts. While many would be righteous in touting the fact that Canada added 28,700 jobs despite the economically depressing drop in oil prices, pessimists are keen to point out that the nation actually lost 28,200 full time jobs, and that the gains were thanks to 56,800 new part time jobs. Regardless, the net positive may have given the BoC a little room to wiggle, which may mean they won’t be looking to cut interest rates at this meeting, instead waiting to see how the economy is progressing. That has the potential to be a good thing for the CAD, though may not break it out of the current range trading prison in which it has been mired in the USD/CAD.
Thursday, April 16, 2015
1:30 GMT Australian Employment Change and Unemployment Rate (March)
There have been some concerns about the Australian economy of late, so much so that market participants have been overwhelmingly expecting the Reserve Bank of Australia to cut interest rates. However, the RBA hasn’t delivered on those expectations, perhaps waiting to see if employment can be strong enough to take that consideration off the table. Last month’s expectation-matching 15.6k result was a step in the right direction as the previous month showed a brutal 12.2k decline. If this release fails to live up to consensus (around 15k), an already overloaded expectation of a cut could intensify and the AUD may suffer as a result. If there is a disappointment, watch for the AUD/NZD to make a run at parity if it hasn’t already gotten there beforehand.
Friday, April 17, 2015
9:00 GMT Eurozone Consumer Price Index (March)
The story of the Eurozone in deflation has already been written and published many times over, so we don’t need to hammer that point home again. However, if the situation is even worse than envisioned, the EUR may suffer even further particularly if Draghi trumps it up a couple of days earlier.
9:30 GMT UK Claimant Count Change and Unemployment Rate (March)
As mentioned earlier, many of the economic releases coming to bear in the UK will be a potential political tool for whichever party it benefits, so watch for a lot of scrutiny around this figure. The last four releases have been pretty good though, with each beating the consensus expectation, so if the streak can continue for a fifth straight month, the GBP/USD may try to get back toward the 1.50 level once again.
12:30 GMT US Consumer Price Index (March)
Inflation has been declining around the world thanks in large part to the constant fall in energy prices, but the US is essentially the only major economy looking to raise interest rates. Last month’s 0.0% annual reading was actually an improvement from the -0.1% reading the month before, so if the momentum can be maintained, it may actually look positive for the USD. Federal Reserve members are also sounding a lot more hawkish than the market interpreted from the minutes of the last Fed meeting which may indicate that they are more prepared to raise interest rates than many expect. If inflation can show positive signs, it could bolster the case of a rate increase sooner (June) rather than later (September).
13:55 GMT University of Michigan/Reuters Consumer Sentiment Index (April)
This is the preliminary release of this highly regarded sentiment indicator and may help guide the USD heading in to the next week. The last two preliminary releases failed to live up to expectations, but the final figures showed improvement and beat expectations, so there is a bit of “to and fro” from this index. Considering the positive tales being told by Fed members of late, watch for this indicator to improve from the previous month as consumers start to buy into the hype.
