The schedule for data releases is lighter than usual this coming week. The calendar year is about to end. The market continues to set records. The stage is set for the annual question:
Will there be a Santa Claus rally in stocks?
Prior Theme Recap
In my last WTWA I predicted a three-part week – some post-holiday digestion of the news, a mid-week focus on the Fed, and a shift to the jobs story. That was pretty accurate, although the continuing decline in oil prices was a constant subject.
Feel free to join in my exercise in thinking about the upcoming theme. We would all like to know the direction of the market in advance. Good luck with that! Second best is planning what to look for and how to react. That is the purpose of considering possible themes for the week ahead.
This Week’s Theme
This is the time of year when the calendar seems to command extra attention. Having escaped the seasonal scare of October and with an eye to year-end price targets, the punditry considers the prospects for a year-end rally. The combination of the calendar, record market highs, and relatively light news brings this question to the fore:
Will there be a Santa Claus Rally in Stocks?
Here are the basic viewpoints:
- Annual seasonal factors are strong. These include the year of the Presidential election cycle, years ending in “5” and similar historical factors. Myles Udland of BI has this story.
- Monthly seasonals are supportive. (USA Today). This speaks to the information highlighted for average investors.
- December is not that special. Mark Hulbert runs the numbers and compares to other periods.
- Any effect will happen in the last few days. (Pension Partners)
- Oil prices might rebound. Urban Carmel analyzes some correlations. (But see my final thoughts below).
- A flattening yield curve and high yield spreads signal possible deflation.
- Economic strength signals potential inflation, sparking faster Fed action.
I have some thoughts about Santa. More about that in today’s conclusion. But first, let us do our regular update of the last week’s news and data. Readers, especially those new to this series, will benefit from reading the background information.
Last Week’s Data
Each week I break down events into good and bad. Often there is “ugly” and on rare occasion something really good. My working definition of “good” has two components:
- The news is market-friendly. Our personal policy preferences are not relevant for this test. And especially – no politics.
- It is better than expectations.
The Good
The news last week was very good, once again even better than stock prices suggested.
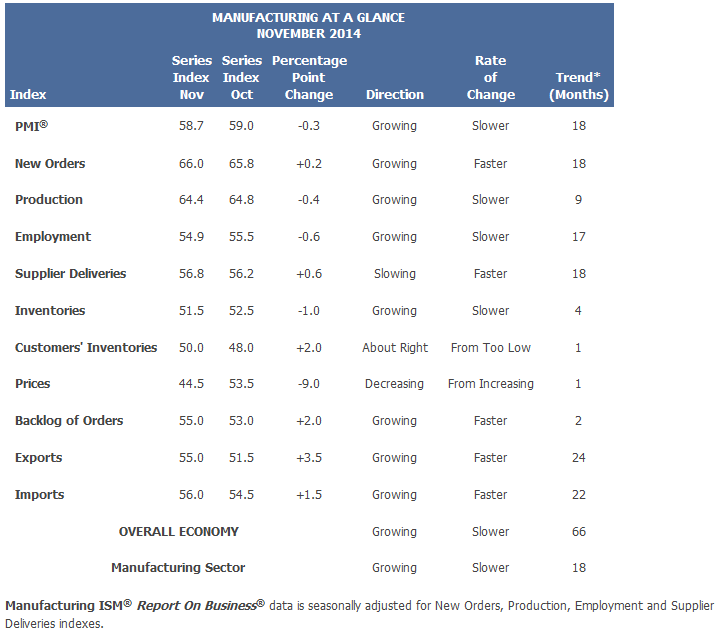
- ISM surveys were strong. The ISM manufacturing survey came in at 58.7 and services at 59.3 ISM research shows that this level corresponds to economic growth of 5.1%. The comments were also strong. See the official source for a good description and a discussion of the internals, which show continuing growth but a mixed story in the rate of growth.
- Declining oil prices – providing benefits to consumers and a long-term boost to stock prices. (NYT) (Also Washington Post). Last but not least, the Fed (via Reuters).
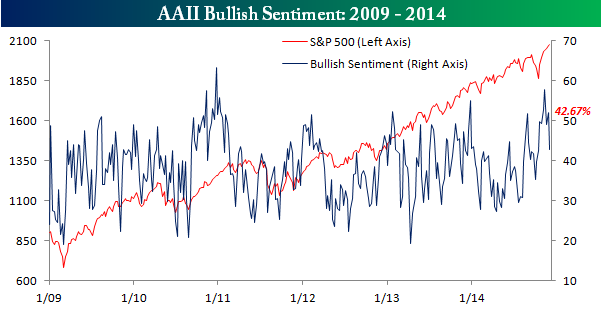
- Investor sentiment has turned more negative (bullish on a contrarian basis). Bespoke has continuing helpful coverage of this subject. I also appreciate AAII’s official coverage of this topic, which notes that optimism is still above the long-term average.
- Chinese stocks get stronger. Josh Brown highlights the move in the ETFs featuring “A Shares” and also notes the implied economic strength for China. This seems counter to current trader expectations. Morgan Stanley agrees.
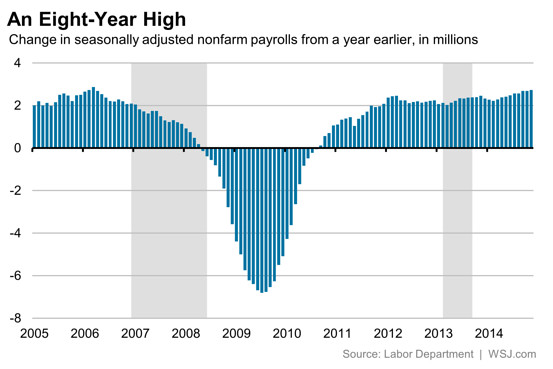
- Employment gains are stronger. This is true whether you look at the number of jobs, the hours worked (gain equivalent to a 400K net job change) revisions, wages, or other elements of the survey of establishments. Here are two great sources:
- Barry Ritholtz is relentlessly focused on the long-term trend, ignoring the monthly deviations. Great advice!
- The WSJ has complete coverage and a balanced ten-chart pack.
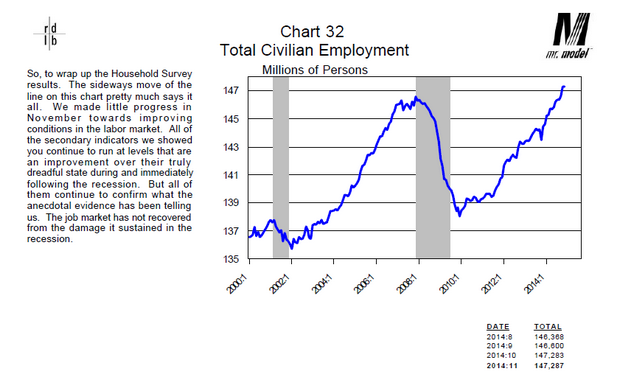
Data spinners have plenty of opportunity on the employment report. One game is to cite whichever survey is weaker – household or establishment. Each has a wide error band and a different method. The conclusions often deviate in the short run. Eventually they converge. Those citing the household survey this month did not do so last month when it was strong. To keep perspective, here is a chart from Bob Dieli’s excellent monthly employment report analysis:
The Bad
There was not very much bad news. There were some very small misses in the data, but nothing really important. Readers are invited to nominate ideas in the comments, but remember that we are focusing on recent developments, not a list of continuing macro concerns.
- Lower oil prices threaten US fracking. The effects might not occur right away, but there is plenty of attention on how profitable the new producers can be and at what price levels. Matthew Philips (Bloomberg Businessweek) has a good analysis.
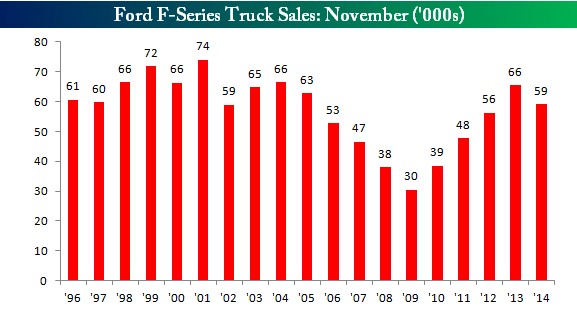
- F-150 Sales. Despite overall strong auto sales, some subgroups deserve extra attention. The Ford (NYSE:F) F-150 is often cited as an indicator for the strength of construction and small business. Bespoke covers this closely and notes the recent decline. They also observe that it is a time of transition to a new model, which has only recently hit the dealers. It bears watching. Here is the chart.
- Factory orders declined 0.7%, MoM. Steven Hansen at GEI does a complete analysis, looking at unadjusted as well as seasonally adjusted data. He concludes:
The data has been soft for three months in a row. Consider that this data is noisy – but the rolling averages (which include transport) are decelerating.
Noteworthy
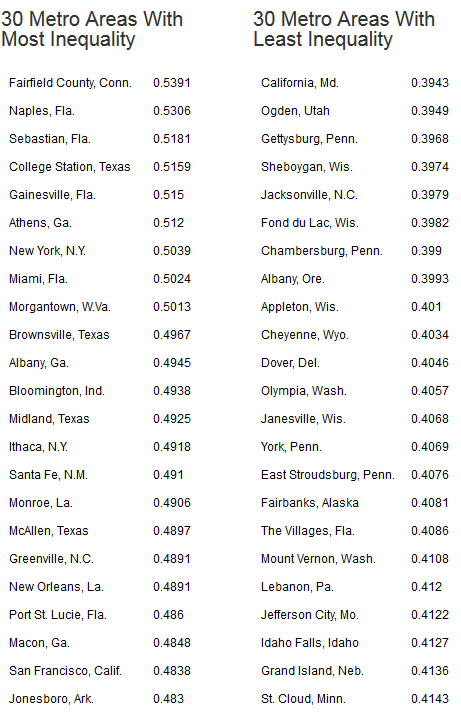
Income inequality commands increasing attention. Here is an interesting analysis on which cities have the biggest gaps.
The Ugly
Congress is back in session, and back in the limelight! Investors basically want to avoid a government shutdown. Meaningful tax reform would be a plus, but seems unlikely. The daily stories feature failed compromises, unlikely proposals, and underhanded deals. It is difficult to forecast accurately, but the results could be very important. I am watching closely.
The Silver Bullet
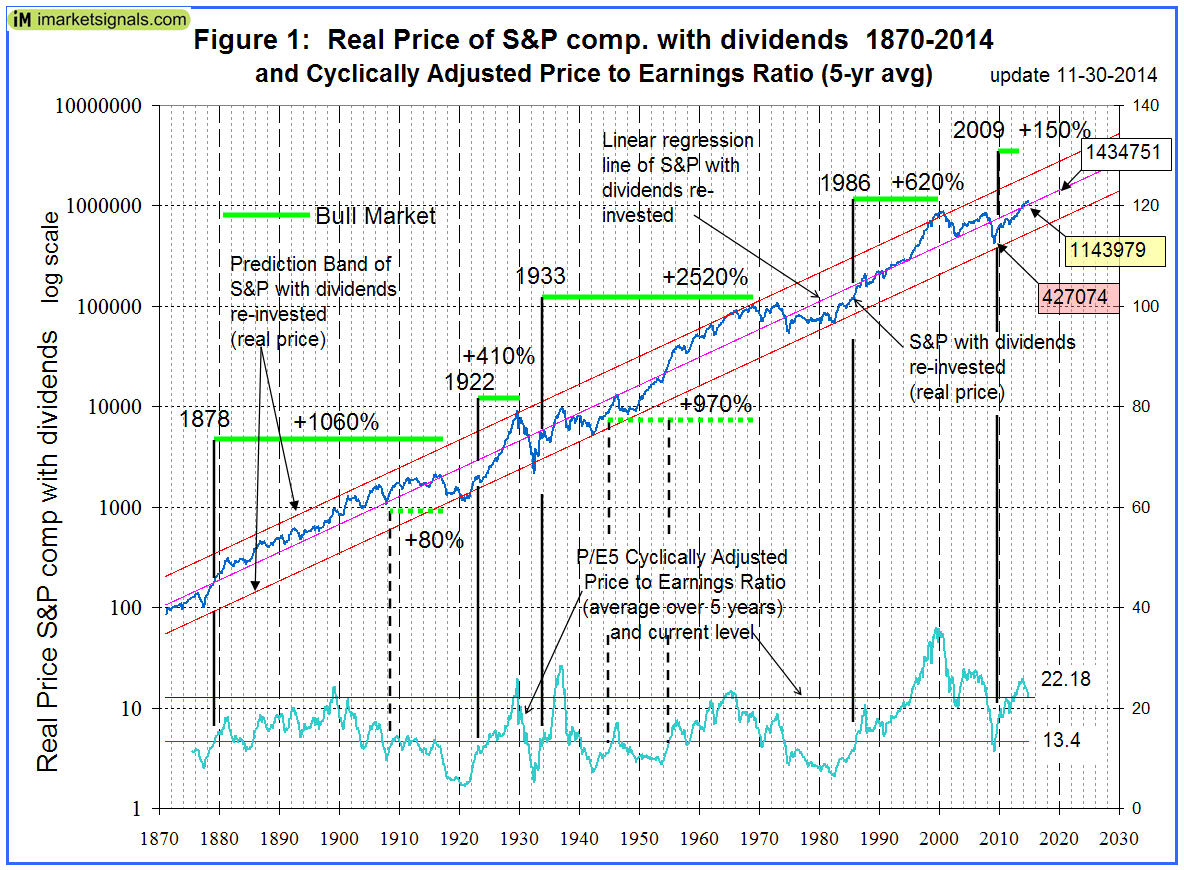
I occasionally give the Silver Bullet award to someone who takes up an unpopular or thankless cause, doing the real work to demonstrate the facts. Think of The Lone Ranger. This week’s award goes to Georg Vrba, for an outstanding response to last week’s challenge. Here was the original chart, which was widely circulated and reposted:
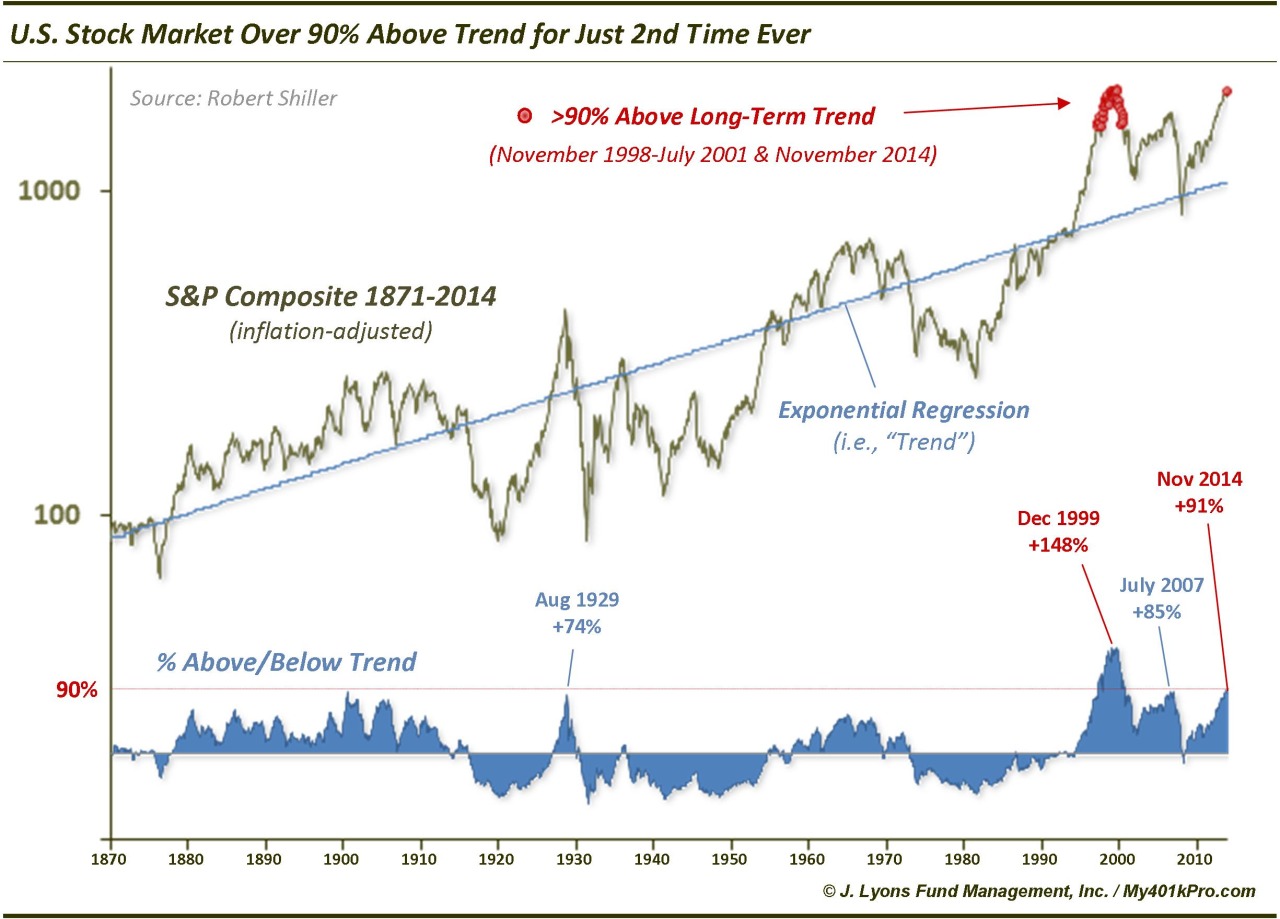
One important problem is that the chart does not take into account the inclusion and compounding of dividends. The dramatic effect of this change is obvious.
It is too bad that Georg’s work, explained further here, does not get as much attention as the original culprit. His method and more analysis is available here. He raised this point more than two years ago. (Honorable mention to several readers who made great comments, including some who cited the dividend issue and others who questioned the long time frame).
Quant Corner
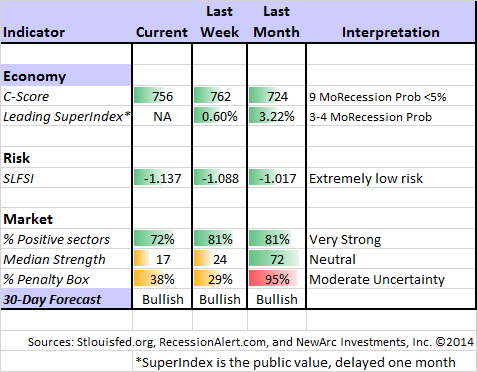
Whether a trader or an investor, you need to understand risk. I monitor many quantitative reports and highlight the best methods in this weekly update. For more information on each source, check here.
Recent Expert Commentary on Recession Odds and Market Trends
Doug Short: An update of the regular ECRI analysis with a good history, commentary, detailed analysis and charts. If you are still listening to the ECRI (three years after their recession call), you should be reading this carefully. This week there is (yet another) change in the ECRI story. See also his regular updates to the “Big Four” economic indicators important for official recession dating. We missed Doug’s updates this week, and hope he is back with us soon!
Georg Vrba: has developed an array of interesting systems. Check out his site for the full story. We especially like his unemployment rate recession indicator, confirming that there is no recession signal. Georg’s BCI index also shows no recession in sight. Georg continues to develop new tools for market analysis and timing. Some investors will be interested in his recommendations for dynamic asset allocation of Vanguard funds. Georg has a new method for TIAA-CREF asset allocation. I am following his results and methods with great interest.
Bob Dieli does a monthly update (subscription required) after the employment report and also a monthly overview analysis. He follows many concurrent indicators to supplement our featured “C Score.”
RecessionAlert: A variety of strong quantitative indicators for both economic and market analysis. While we feature the recession analysis, Dwaine also has a number of interesting market indicators.
Dwaine has a new post on valuation, refuting some of the arguments about “nosebleed levels.” Check it out. Dwaine concludes:
We have a far better stock market valuation model to manage investment risk, one which can forecast forward two-year returns with a correlation coefficient of 0.65 (amazing for this short span of time), and which is surprisingly adept at warning of bear markets and recessions. This we will cover for subscribers in our December research note in the Research main menu.
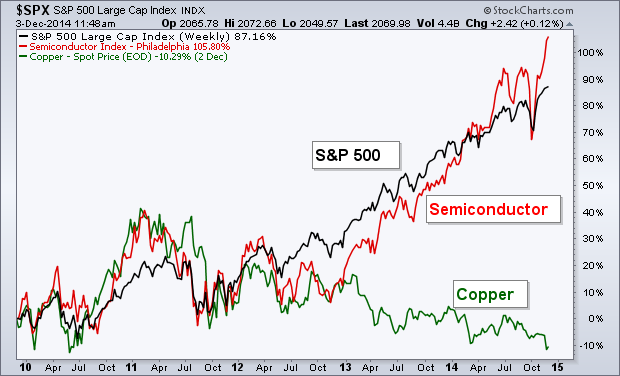
A replacement for Dr. Copper? Andrew Thrasher nominates Semiconductors.
The Week Ahead
There is a lot of data packed into three days of a holiday-shortened week for some of the global markets.
The “A List” includes the following:
- Initial jobless claims (Th). The best concurrent news on employment trends, with emphasis on job losses.
- Michigan sentiment (F). A new high in prospect? Good concurrent indicator for spending and employment.
- Retail sales (Th). Some are looking for big gains to match same-store sales.
The “B List” includes the following:
- JOLTS report (T). When USA Today headlines the quit rate, the world is finally catching on to the importance of this report.
- PPI (F). Inflation at the wholesale level. It matters little until it shows a real pop for a few months and starts to bleed into CPI and PCE.
- Business inventories (Th). October data that will influence perceptions (and ultimately reality) of Q4 GDP.
- Wholesale inventories (T). Early implications for Q4 GDP.
The speech schedule is pretty light on the Fed front.
How to Use the Weekly Data Updates
In the WTWA series I try to share what I am thinking as I prepare for the coming week. I write each post as if I were speaking directly to one of my clients. Each client is different, so I have five different programs ranging from very conservative bond ladders to very aggressive trading programs. It is not a “one size fits all” approach.
To get the maximum benefit from my updates you need to have a self-assessment of your objectives. Are you most interested in preserving wealth? Or like most of us, do you still need to create wealth? How much risk is right for your temperament and circumstances?
My weekly insights often suggest a different course of action depending upon your objectives and time frames. They also accurately describe what I am doing in the programs I manage.
Insight for Traders
Felix continued the profitable bullish posture for another week. There is reasonable breadth among the strongest sectors. Ratings have continued to drift lower, but are still quite solid in about half of the sectors. Felix does not anticipate tops and bottoms, but responds pretty quickly when there is evidence of a change. The penalty box can be triggered by extremely high volatility and volume. It is similar to a trading stop, but not based only on price. There has been quite a bit of shifting at the top, so we have done some trading.
Felix got interested in China A-Shares this week and still recommends iShares FTSE/Xinhua China 25 Index (ARCA:FXI).
You can sign up for Felix’s weekly ratings updates via email to etf at newarc dot com.
Insight for Investors
I review the themes here each week and refresh when needed. For investors, as we would expect, the key ideas may stay on the list longer than the updates for traders. The recent “actionable investment advice” is summarized here.
Last week brought a rush of scare stories aimed at both the long and short term. I took a closer look at the most recent themes Keeping Investors Scared Witless. If you missed it, please take a look.
Other Advice
Here is our collection of great investor advice for this week:
Stock Ideas
Companies that have the most to lose in the energy space (MarketWatch).
SocGen says it is time to buy Europe. I wonder if they will ever recommend the US.
The most-shorted stocks. (Akin Oyedele at BI).
Investor Psychology
Individual investors remain very worried (via Schwab). They fear market declines and a possible crash. They are much more bearish than institutional investors, as shown by the chart below. This is why so many stocks, especially cyclicals and financials, are currently inexpensive.
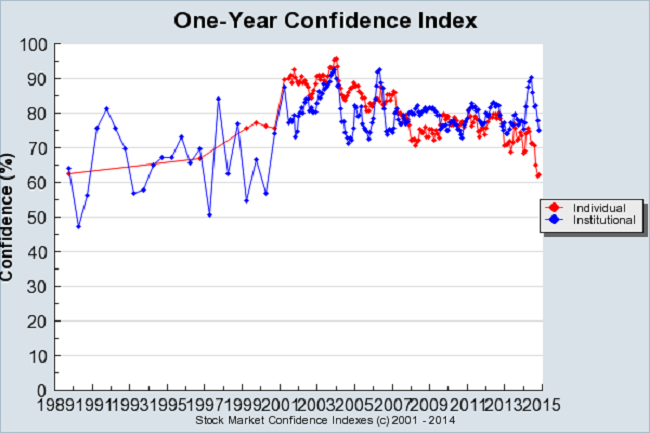
Similar results from Yale – lots of good data in their Stock Market Confidence Indices.
Tactical Considerations
Do stock buybacks work? This interview with Todd Sullivan will help you find the winners.
Behavioral biases limit investment performance in many ways. Josh Brown highlights one for each letter of the alphabet from the Psy-Fi Blog.
Market Outlook
Tim Duy – the top Fed watcher – is optimistic about the projected policy course. He has been very accurate (and contrarian).
Former Value Line market expert Sam Eisenstadt has a model based upon his 63 years of experience. He sees 11% stock gains in six months. (Mark Hulbert)
Bill McBride has an excellent update of a post from two years ago: The Future’s so Bright… See the whole post for the charts you would expect, but here is the key conclusion:
Over two years ago I said that looking forward I was the most optimistic since the ’90s. And things are only getting better. The future’s so bright, I gotta wear shades.
I always try to provide a wide range of interesting links. If you only follow one of them this week, check out the most recent strong entry from Morgan Housel. He has a list of predictions that he feels strongly about – all worth considering. Here is my favorite:
Pessimism will overshadow progress. Twenty years from now,someone will be sitting in his or her self-driving car on the way home from a doctor’s appointment that miraculously cured a disease that’s currently a death sentence, and will be complaining about how awful the world is. It’s always this way. The odds are incredibly high that the average American will have a higher standard of living 20 years from now; yet, we’ll look back at untold numbers of books and articles lamenting that everything sucks. Few will notice how much progress we’ve made because it happens slowly; but they’ll pay attention to the doom forecasts because they are repeated day in, day out.
Second place would be his 16 rules for investors to live by. My favorite here?
Don’t check your brokerage account once a day and your blood pressure only once a year.
Constant updates make investing more emotional than it needs to be. Check your brokerage account as infrequently as necessary to prevent you from becoming emotional about market moves.
Final Thought
I avoid making short-term market forecasts...leaving that to Felix!
I also generally eschew the “seasonal” forecasts. The underlying rationale is often weak and/or not applicable. The end of the Presidential cycle, for example is supposed to reflect efforts to support the party in the next election. The current situation – Obama legacy at stake, GOP Congress, possible compromises – do not really fit that pattern. Years ending in “5” seems like data mining.
I prefer to ignore the calendar and follow a process of constantly upgrading price targets on individual holdings. This is consistent with a key precept:
Do not follow the market. Instead take advantage of what the market is giving you.
To do this you need a method for finding underpriced stocks and confidence to stick to your methods, even when the market disagrees. If you think the markets are efficient, you should just buy index funds.
Most people lack confidence and therefore drift from theme to theme, chasing what worked last month or last year. They have a fixation on what they read in the financial news, forgetting that their business model is selling advertising and yours is making money.
Here are three themes that have my attention:
- The correlation between oil price declines and economic weakness. Quite a few observers are doing a simple correlation between lower oil prices and (for example) lower consumer spending. While everyone parrots the “correlation does not imply causation” meme, it is often forgotten in practice. What is happening here is that commodity price declines are usually correlated with weak economic growth, so many other data series seem to be correlated as well. In this case oil prices reflect supply as well as worldwide demand. A true statistical test would have a control for situations where the US economy is strong while oil prices declined, perhaps using a variable like employment growth. Failure to do so leads to a spurious relationship.
- Oil prices and oil stocks. There are a wide range of forecasts on oil prices (low and high), but many of the stocks already seem to reflect a very bearish case. I am working on a more detailed analysis, especially parts of the energy complex that benefit from lower oil prices.
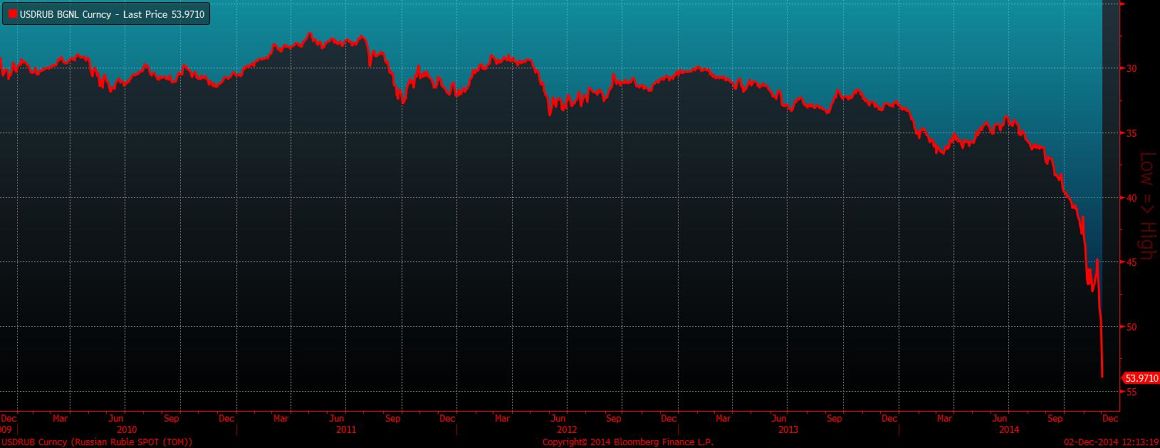
- Russia and the Ukraine. Part of the drag on worldwide growth is the reciprocal sanctions related to the Ukraine. The benefits of decades of trade deals are being lost. A fundamental concept of the linking of nations in the global economy was to reduce “antisocial” behavior. My sense is that progress on the Ukraine situation would provide an immediate spark to the Russian and European economies, improving markets for China and the US. It is in the interest of everyone, suggesting that eventually it will happen. Joe Weisenthal, operating from his new base at Bloomberg Politics, summarizes the pain of Putin in a series of charts. “It is not a good time to be Vladimir Putin.” Picking just one of his excellent charts, here is the value of the Ruble.
The economic data provide a good guide for the long-term investor, but the reward might not come from this year’s Santa.

