There is a psychological barrier at market tops. Think about this conundrum:
- By definition, a former top failed. That is how it got to be a top!
- A new high is the most bullish thing a market can do. Also by definition, since going higher means reaching and taking out old tops.
For story "A" feel free to do a Google search for "lofty levels" or the like, perhaps including the name of a popular pundit. Alternatively, you can search for "double top" or "triple top."
For story 'B" we find those whose business success is firmly aligned with the success of their investors – independent financial advisors. Josh Brown is a leading advocate for this group and he does a nice job analyzing a complex story. Ned Davis Research looks at past occasions when the market revisits prior highs. Mark Hulbert reports the story. Hulbert gets featured on CNBC. Everyone involved acknowledges that there are only 13 prior cases, so we should not make much of this.
And then we do.
Josh has exactly the right touch, navigating between data analysis and a few anecdotes. He is not wildly bullish, but he understands that a little data can be a helpful antidote to misleading headlines. Here are the past occasions from Ned Davis:
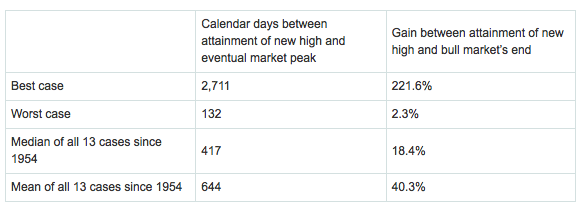
Even allowing for the small number of cases, the result is encouraging.
I have some further thoughts about the new high which I'll report in the conclusion. First, let us do our regular update of last week's news and data.
Background on "Weighing the Week Ahead"
There are many good lists of upcoming events. One source I especially like is the weekly post from the WSJ's Market Beat blog. There is a nice combination of data, speeches, and other events.
In contrast, I highlight a smaller group of events. My theme is an expert guess about what we will be watching on TV and reading in the mainstream media. It is a focus on what I think is important for my trading and client portfolios.
This is unlike my other articles at "A Dash" where I develop a focused, logical argument with supporting data on a single theme. Here I am simply sharing my conclusions. Sometimes these are topics that I have already written about, and others are on my agenda. I am putting the news in context.
Readers often disagree with my conclusions. Do not be bashful. Join in and comment about what we should expect in the days ahead. This weekly piece emphasizes my opinions about what is really important and how to put the news in context. I have had great success with my approach, but feel free to disagree. That is what makes a market!
Last Week's Data
Each week I break down events into good and bad. Often there is "ugly" and on rare occasion something really good. My working definition of "good" has two components:
- The news is market-friendly. Our personal policy preferences are not relevant for this test. And especially -- no politics.
- It is better than expectations.
This was a pretty good week for economic data. There was bad news, but mostly with a political angle.
- The State Department report on the Keystone Pipeline found few problems. Advancing the pipeline is a market-friendly event.
- Homeowners are getting above water. Zillow reports that underwater borrowers have declined by two million in the last year. The CoreLogic numbers are a little lower.
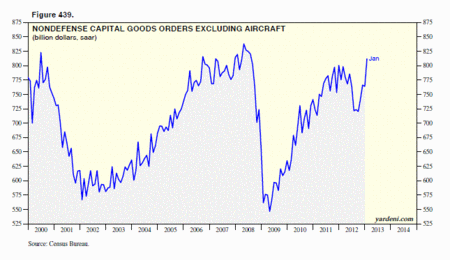
- Business investment is stronger. This is a crucial factor, given the strong corporate balance sheets and the pre-election jitters. Dr. Ed writes as follows:
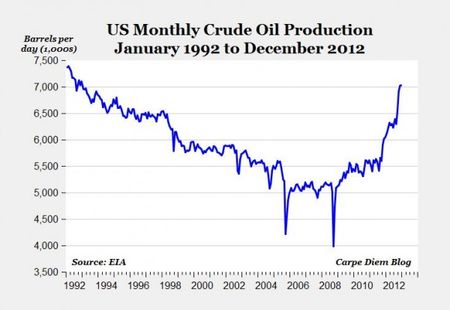
- US oil production hits a new high. Ultimately this will be a positive for the trade balance, GDP, and fuel prices, but it is a work in progress. Here is the dramatic chart from Mark Perry:
- Michigan sentiment was even higher than the preliminary estimate. Doug Short has good analysis and a fine chart.
- The ISM index beat expectations. The results are consistent with GDP growth of about 3.7%, although recent readings have seemed to over-state the relationship from the ISM historical data. Most of the underlying components were also solid.
- Bernanke's Congressional testimony clarifies and emphasizes the Fed commitment to monetary stimulus. Markets rallied, but many pundits are more interested in arguing their personal viewpoints about the Fed instead of accepting and profiting from the reality.
It was a tough week for the world's leading democracies and their leaders. There was also some soft data.
- Personal income dropped dramatically. See Steven Hansen at GEI for a full analysis and some interesting charts.
- The Italian election. The immediate market reaction was very negative. The hot money follows simple rules. This looked like the return of an old story – one which had major effects in the past. After the recent stock market advances, many were looking for a reason to sell. The story deserves deeper analysis. My own current conclusion is that it is yet another installment in the ongoing negotiations. It is a process of democracy, which Mark Mazower calls a "political meltdown." Those of us who are more comfortable with democracy might see this as a healthy push back against austerity. The Economist offers this take:
"Italy's political convulsions underline the need for Mrs Merkel to adapt her prescription. So far it has been a lot of austerity and some reform; it should be the other way round."
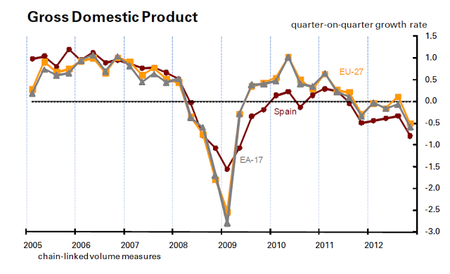
Whatever your political viewpoint, this is not a signal of imminent Eurozone collapse, dominoes, cockroaches or whatever, or an instant impact on US stocks. I am watching the yield on Italian and Spanish bonds, which moved higher and then pulled back – not at a danger level. - Spanish GDP is looking ugly (via Bonddad).
- Sequestration began with far-reaching implications if an agreement is not reached soon. Most often trumpeted is the overall macro effect of a reduction of GDP in the range of 0.5 to 1%. One important illustration is the effect on domestic energy production. Here is the report from the Oil & Energy Insider, which also has several other timely and helpful stories.
For fossil fuels, it doesn't look good, either: The immediate effect will be a delay in the development of oil and gas projects on federal lands due to program cuts at the Department of the Interior. According to Salazar, we're talking about 300 fewer onshore oil and gas leases issued in western states, and delays for some of the 550 offshore oil and gas projects in the Gulf of Mexico."
- Gas prices were up six cents a gallon last week. But there is hope. The EIA expects prices to fall later this year. And the Senate is going to investigate the "unreasonable increase" in gasoline prices during the past year. Thank goodness for that!
Prospects for compromise on deficit reduction. These headlines from The Hill tell the story:
Boehner says no new taxes after sequester meeting in White House
Pelosi: No budget deal without new revenues
'I am not a dictator,' Obama says
Unlike past political "deadline events," I did not forecast an eleventh-hour solution for this one. The immediate consequences are important, but not catastrophic. The long-term consequences of a deal are important. All parties have a current incentive geared to these interests rather than a fast solution.
So we should not expect a fast answer. I think that we will get one in a month or two – a good subject for a full-length analysis. Unlike some others, I avoid speculation in the absence of solid information. We'll know more soon.
The Indicator Snapshot
It is important to keep the current news in perspective. My weekly snapshot includes the most important summary indicators:
- The St. Louis Financial Stress Index.
- The key measures from our "Felix" ETF model.
- An updated analysis of recession probability.
The SLFSI is not a market-timing tool, since it does not attempt to predict how people will interpret events. It uses data, mostly from credit markets, to reach an objective risk assessment. The biggest profits come from going all-in when risk is high on this indicator, but so do the biggest losses.
The C-Score is a weekly interpretation of the best recession indicator I found, Bob Dieli's "aggregate spread." I have now added a series of videos, where Dr. Dieli explains the rationale for his indicator and how it applied in each recession since the 50's. I have organized this so that you can pick a particular recession and see the discussion for that case. Those who are skeptics about the method should start by reviewing the video for that recession. Anyone who spends some time with this will learn a great deal about the history of recessions from a veteran observer.
I have promised another installment on how I use Bob's information to improve investing. I hope to have that soon. Anyone watching the videos will quickly learn that the aggregate spread (and the C Score) provides an early warning. Bob also has a collection of coincident indicators and is always questioning his own methods.
I also feature RecessionAlert, which combines a variety of different methods, including the ECRI, in developing a Super Index. They offer a free sample report. Anyone following them over the last year would have had useful and profitable guidance on the economy. RecessionAlert has developed a comprehensive package of economic forecasting and market indicators. I will try to do a more complete review soon. Dwaine Van Vuuren also has an excellent data update, demonstrating how the coincident data have reduced recession prospects.
Doug Short has excellent continuing coverage of the ECRI recession prediction, now well over a year old. Doug updates all of the official indicators used by the NBER and also has a helpful list of articles about recession forecasting. His latest comment points out that the public data series has not been helpful or consistent with the announced ECRI posture. Doug also continues to refresh the best chart update of the major indicators used by the NBER in recession dating.
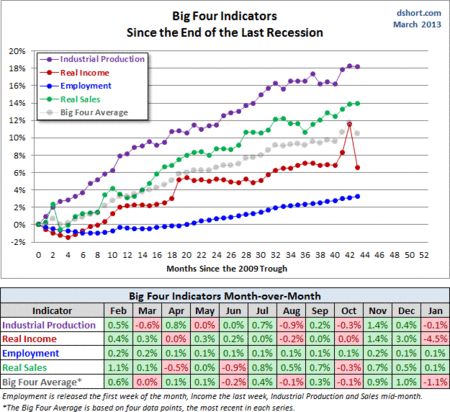
The year-end effect of the fiscal cliff debate on real income is apparent, as is the resumption of the payroll tax.
The average investor has lost track of this long ago, and that is unfortunate. The original ECRI claim and the supporting public data were expensive for many. The reason that I track this weekly is that it is important for corporate earnings and for stock prices. It has been worth the effort for me, and for anyone reading each week.
Readers might also want to review my Recession Resource Page, which explains many of the concepts people get wrong.
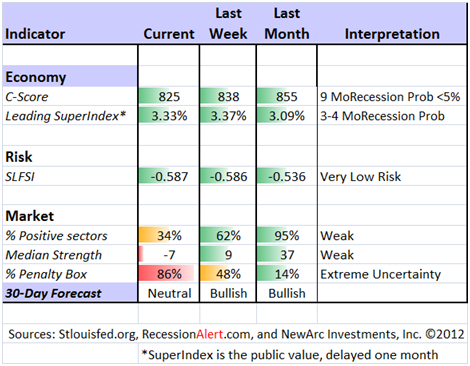
Our "Felix" model is the basis for our "official" vote in the weekly Ticker Sense Blogger Sentiment Poll. We have a long public record for these positions. About a month ago we switched to a bullish position. These are one-month forecasts for the poll, but Felix has a three-week horizon. Felix's ratings stabilized at a low level and improved significantly over the last few weeks. The penalty box percentage measures our confidence in the forecast. A high rating means that most ETFs are in the penalty box, so we have less confidence in the overall ratings. That measure remains elevated, so we have less confidence in short-term trading.
The Week Ahead
This week brings little data and scheduled news, an artifact of the calendar and the holidays.
The "A List" includes the following:
- Employment situation report (F). This is always the most important data for markets.
- Initial jobless claims (Th). Employment will continue as the focal point in evaluating the economy, and this is the most responsive indicator.
- ADP private employment (W). This has been as good as the "official" numbers.
- ISM service index (T). Especially watch the employment component.
- The Beige Book (W). Anecdotal evidence that provides color for the next FOMC meeting.
- Trade balance (Th). Worth watching for overall trends (especially in energy) and also the GDP effect.
- Factory orders (W). Older data, but still a significant factor.
Trading Time Frame
Felix was marginally bullish last week. [I missed my regular weekly posting.] We actually reduced trading positions to 2/3. This week's further decline in the ratings has moved Felix's forecast to neutral and we are only 1/3 invested for trading accounts. This could change very quickly. At the moment, it is more likely to shift to bearish than back to positive.
One of the things that Felix does best is controlling risk. Even when Felix delivers only normal market returns, the result is accomplished with less risk.
Investor Time Frame
Each week I think about the market from the perspective of different participants. The right move often depends upon your time frame and risk tolerance.
Buying in times of fear is easy to say, but so difficult to implement. Almost everyone I talk with wants to out-guess the market. The problem? Value is more readily determined than price! Individual investors too frequently try to imitate traders, guessing whether to be "all in" or "all out."
This week's Barron's has a cover story describing how the big-time wealth managers are recommending a shift from bonds to stocks.
"The world hasn't collapsed, and there's a beginning of a normalization in the way we look at the markets," says Chris Wolfe, chief investment officer at Merrill Lynch Wealth Management.
Go ahead and read the Barron's story. Please compare this to my 2013 preview. This covers the same theme along with some other key catalysts. There are also some specific stock and sector ideas. My recommendations did well last year, and we are off to another good start. You need to be comfortable in taking the other side of one of the most hated rallies in history.
But please beware! General ideas are not for everyone. Each person needs unique treatment. We have several different approaches, including one that emphasizes dividend stocks with enhanced yield from writing near-term call options.
We have collected some of our recent recommendations in a new investor resource page -- a starting point for the long-term investor. (Comments and suggestions welcome. I am trying to be helpful and I love feedback).
Final Thought
Should we be worried about the new market top?
I recently suggested that investors are too easily victimized by the media focus on fear. Many have missed a nice market move (so far) by following those who offered headlines without data. There is an infinite supply of headlines!
It is a sad irony that our intelligence and reading – skills that work so well on most fronts – fail us so badly when it comes to investment decisions. The intelligent investor will always find persuasive things to worry about.
Abnormal Returns, everyone's choice for the leading curator of financial stories, noted that I was not alone on this theme. Tadas has an excellent story, with great quotations from Barry Ritholtz, Josh Brown, and Seth Godin. Pulling together these stories is both rare and helpful, so please take a look. It is also one of many important themes from his book.
We are all suggesting, in slightly different ways, that the best investment choices require more than simply following the list of worries from financial media.
