Once again, the market focus has turned to the Fed. For many months the official Fed policy has included an inflation target, an annual rate of 2%. For many months I have written that inflation will not matter until this level is in play. Suddenly, after a single month of data approaching this range, some believe that inflation is a threat.
There is plenty of economic data next week, and there could well be a fresh theme from housing news. Despite this, I think that the economic stories will all be interpreted through the lens of last week’s news. Expect a hair-trigger sensitivity to price increases and a special focus on the PCE index release. The media and punditry will engage in their favorite sport – second-guessing the Fed!
Prior Theme Recap
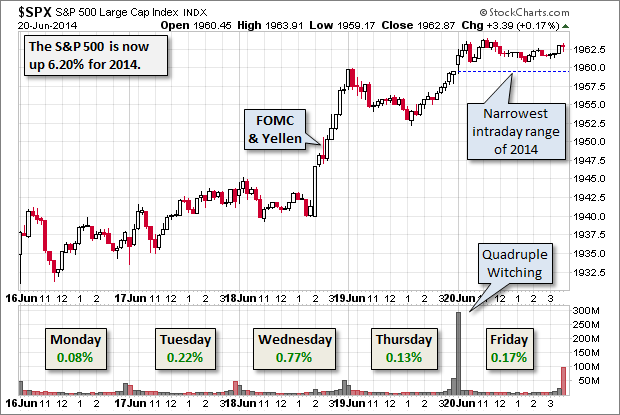
Last week I expected some early news on Iraq before a mid-week shift to the Fed. That was pretty accurate. The Fed news was the major event of the week. On Friday we had the lowest volatility of the year, despite a “quadruple witching” options expiration. Doug Short has a regular feature capturing the week just past with one of his terrific charts – the whole story in one picture.
Naturally we would all like to know the direction of the market in advance. Good luck with that! Second best is planning what to look for and how to react. That is the purpose of considering possible themes for the week ahead.
This Week’s Theme
With plenty of economic data and little earnings news, expect anyone with a microphone to ask interview subjects if the Fed is “behind the curve.” They will all oblige with an answer. Joe Weisenthal always has the pulse of the financial community, and he sees this as the big story of the summer. He highlights Fed Chair Yellen’s answer that recent price increases were “noise” and the skepticism from the Street.
With that in mind, let us start with some factual background.
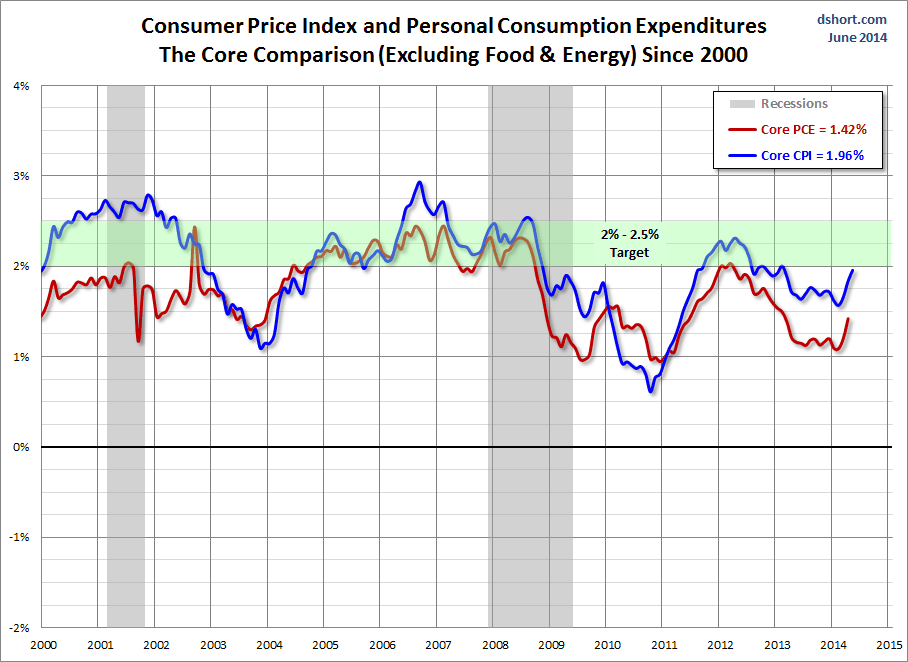
There are many different measures of inflation. The Fed prefers the Personal Consumption Expenditure Index (which will be updated this week).
- Why? It better captures the impact on consumers than the CPI. From The Economist:
The two indexes frequently diverge because they are constructed differently. While the weights in the CPI basket change only every few years, the PCE’s change each month, better capturing consumers’ tendency to shift from more expensive commodities and outlets to cheaper ones. The CPI’s weights are also determined by what consumers say they spend, whereas the PCE index is based on what they actually spend, or what is spent on their behalf, such as the employer’s portion of health insurance, and what the federal government spends on Medicare. As a result the CPI assigns much more weight to rent and housing and much less to health care. PCE inflation over time typically runs about 0.3% below CPI inflation, but the current divergence, at 0.7%, is the largest in more than a decade, according to Goldman Sachs.
- Some Fed participants might not agree. (See the St. Louis Fed message).
- The overall effect of PCE is a lower estimate of inflation. (Chart from Doug Short).
Is Fed policy too relaxed? Here are the key perspectives:
- Inflation is already above the 2% target. There is less labor slack than the Fed believes. Even if recent price increases are temporary an economic rebound will rekindle the price pressure. (Martin Feldstein op-ed).
- Inflation is just about right, given the Fed target. (Ed Yardeni).
Where do I stand? I am in the middle, predicting that economic growth will stay moderate and that inflation will remain modest (or vice-versa). Admittedly, the core CPI inflation rate, on an annualized three-month basis, has been rising rapidly recently, from 1.4% in February to 1.8% in March to 2.2% in April to 2.8% in May.
Looking at the various components of the CPI shows that the recent flare-up in the core inflation rate has been relatively widespread. So there may be something to the reflation story, but we aren’t convinced just yet. In any event, we are feeling more comfortable with our 2.5%-3.0% range for the 10-year Treasury yield than we did on May 28 when the yield fell to the most recent low of 2.4%.
- Inflation concerns are overblown. (Analysis from Mark Thoma).
- Janet Yellen is actually an inflation hawk, given the economic forecast. (Fed Expert Tim Duy).
- The US is in line with long-term inflation trends and is certainly not like Argentina! (Scott Grannis – good charts).
Which of these viewpoints is correct? As usual, I have some thoughts that I will share in the conclusion. First, let us do our regular update of the last week’s news and data. Readers, especially those new to this series, will benefit from reading the background information.
Last Week’s Data
Each week I break down events into good and bad. Often there is “ugly” and on rare occasion something really good. My working definition of “good” has two components:
- The news is market-friendly. Our personal policy preferences are not relevant for this test. And especially – no politics.
- It is better than expectations.
The Good
There was some encouraging news last week.
- Homebuilder sentiment moved higher. The reading of 49 beat expectations, but it not quite positive. (Reuters).
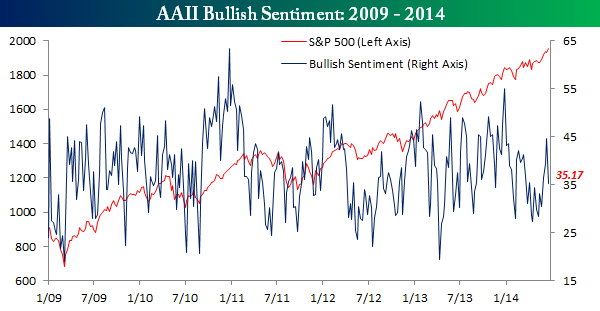
- Investor sentiment has turned negative –and that is a contrarian positive. The sentiment from the AAII was in the “bad news” just last week, so it is making some quick changes. Bespoke has the story and a beautiful chart showing the big shift:
- Leading indicators were in line with expectations, but that confirmed positive news.
- Industrial production beat expectations, growing 0.6%. (See the WSJ).
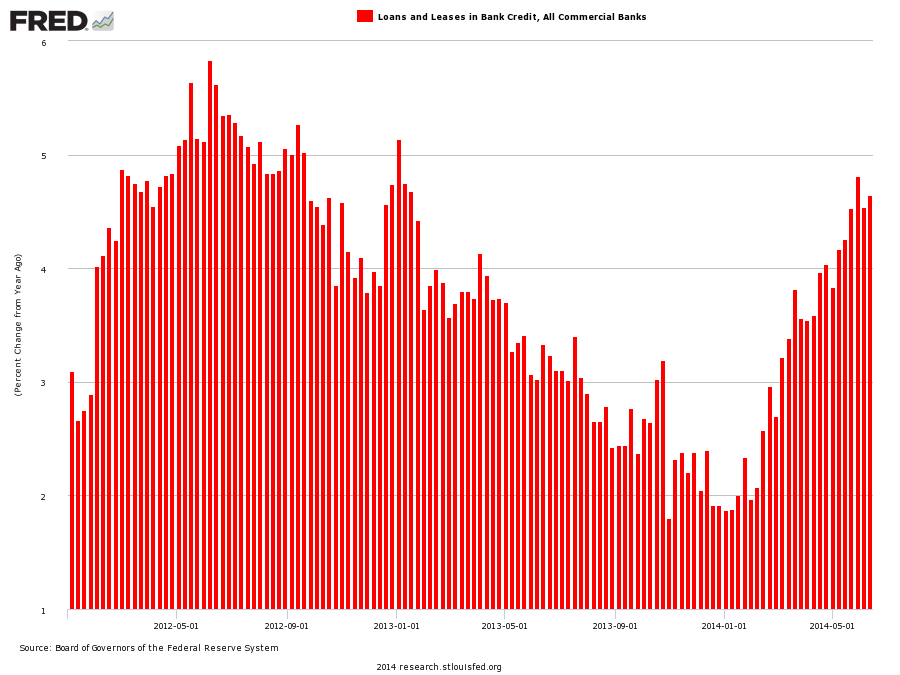
- Commercial credit is rising. Joe Weisenthal calls it the “best economic news of the week.” Most people do not understand that a key economic issue is that the liquidity provided by the Fed is not finding its way into the money supply. Bank lending is a key, especially to small businesses. Here is the chart:
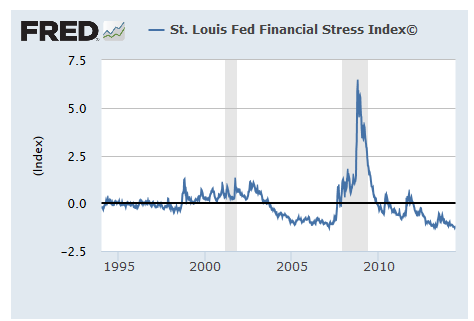
- The St. Louis Financial Stress Index registered an all-time low. I have been highlighting this indicator for years. One of my top researchers spent a summer analyzing the past data, helping to develop a method for risk control (free paper available on request). It is amazing how many investors prefer to be scared witless (TM OldProf) rather than monitor this objective measure of risk. Here is the story and chart from the St. Louis Fed.
The Bad
The economic news included some negatives as well.
- Oil and gasoline prices move higher. New Deal Democrat’s excellent weekly summary of high-frequency indicators highlights this move as the most important feature of his report. He writes as follows:
The oil price spike due to Iraq continued this week. This will bleed through to gas at the pump in the next few weeks. The Oil choke collar is re-engaging, and if Iraq falls apart, or if its oil exports are disrupted, there will be economic consequences here.
There is no denying the increase in energy prices, but there are different interpretations of the effects. Michael Santoli suggests: “Yet better average gas mileage, higher wages and a dramatic decline in miles driven since 2008 means a further climb in gas prices probably wouldn’t pinch consumers noticeably unless it reached the new “pain point” of about $4.25 a gallon”.
Prof. James Hamilton, our go-to expert on energy and the economy, reviews his research and also includes a helpful calculator showing the relationship between oil and gasoline prices. If you pick $4.25 as your “pain point” that implies about $137/barrel for Brent crude. $4.00 per gallon is about $10/barrel lower.
Higher energy prices are like a tax on consumers with no corresponding payoff. There is also no specific trigger point. Not everyone will react in the same way of course, truly a case of YMMV.
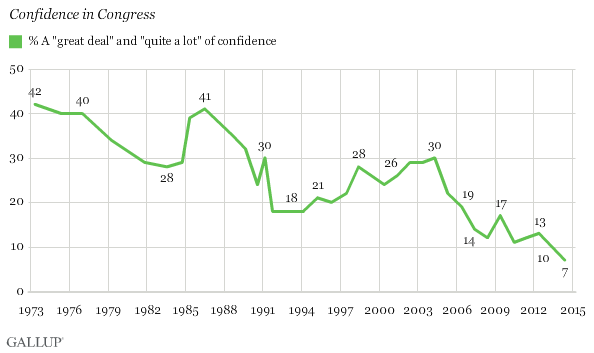
- Confidence in Congress hits a new low. (Some might see this as “good news” since it suggests possible change!) It is not quite that easy. People typically blame the institution of Congress while re-electing their own representative. Viewed from the other direction, making the right decision requires some support and compromise. Gridlock has not worked very well. Here is the recent chart (via Gallup).
- The Iraq conflict is threatening refineries. This is the step that would really affect oil prices and the world economy. This Canadian story emphasizes the effects on consumers. GEI highlights a BBC video explaining ISIS, the Sunni group behind the insurgency. Do you have 90 seconds to spare?
- Americans go further into debt to pay the basics. (MarketWatch OpEd, but compare above and note the difference in borrowers). The credit card companies can borrow at near-zero rates, which helps to reduce lending standards. While we could have paid cash for Mrs. OldProf’s new wheels, why not finance at zero percent for five years when that beats the cash incentive? These measures of debt are challenging to interpret.
- Sea container counts are lower. It is the second consecutive month. Steven Hansen, writing at Global Economic Intersection has the complete story with excellent data comparisons and charts. We also wish to congratulate GEI on their well-deserved surge in the blog rankings. As an early contributor, friend, and occasional critic (constructive I hope), I am delighted to see the success of my friends.
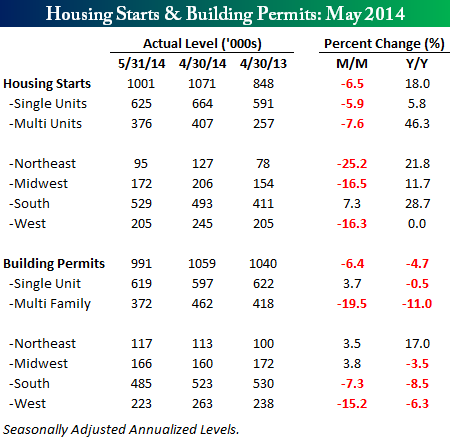
- Building permits and housing starts were weak – very weak. This happened in spite of the rebound in builder sentiment. Bespoke has a great overall summary with tables and charts. Calculated Risk, our featured source on housing matters, still believes the story will improve because of year-over-year comparisons and general growth. See Bespoke’s full story, but here is one helpful table:
The Ugly
Cheating. Here are three examples in recent news.
- The World Cup: The New Yorker’s Cheating the Beautiful Game
- Chess: How To Catch A Chess Cheater: Ken Regan Finds Moves Out Of Mind
- Bridge: The Captain of the US Senior team on how they exposed the German pair of “coughing doctors” in the World Championship Final in Bali. (Appeal pending).
These are not the only examples from sports and games, of course. You could also make up a list from politics, business, and finance. In the examples I suggest, the violations are all the result of studying records after the fact.
The Silver Bullet
I occasionally give the Silver Bullet award to someone who takes up an unpopular or thankless cause, doing the real work to demonstrate the facts. Think of The Lone Ranger. No award this week. Nominations are always welcome!
Quant Corner
Whether a trader or an investor, you need to understand risk. I monitor many quantitative reports and highlight the best methods in this weekly update. For more information on each source, check here.
Recent Expert Commentary on Recession Odds and Market Trends
RecessionAlert: A variety of strong quantitative indicators for both economic and market analysis.
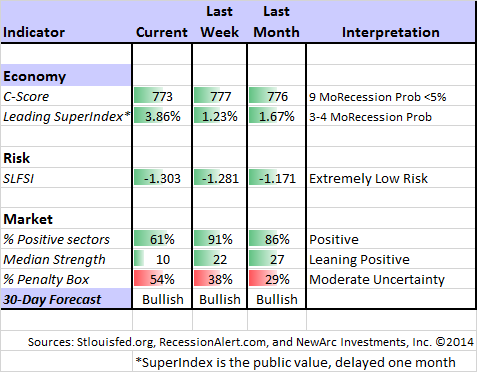
Bob Dieli does a monthly update (subscription required) after the employment report and also a monthly overview analysis. He follows many concurrent indicators to supplement our featured “C Score.” One of his conclusions is whether a month is “recession eligible.” His analysis shows that none of the next nine months could qualify. I respect this because Bob (whose career has been with banks and private clients) has been far more accurate than the high-profile TV pundits.
Georg Vrba: Updates his unemployment rate recession indicator, confirming that there is no recession signal. Georg’s BCI index also shows no recession in sight. For those interested in hedging their large-cap exposure, Georg has unveiled a new system.
Doug Short: An update of the regular ECRI analysis with a good history, commentary, detailed analysis and charts. If you are still listening to the ECRI (2 ½ years after their recession call), you should be reading this carefully. Doug includes the most recent ECRI discussion, which has been consistently bearish, including the blown call on the recession.
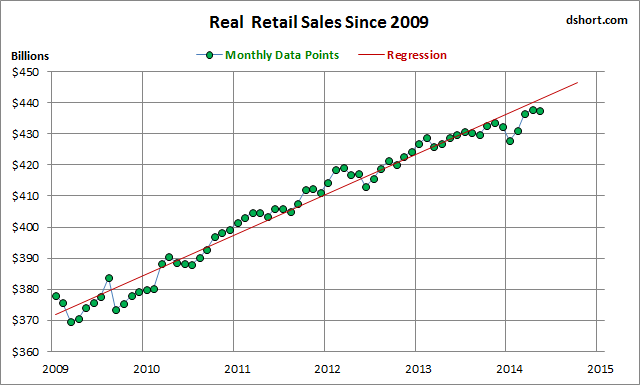
Doug also has the best continuing update of the most important factors to the NBER when they analyze recessions. This week he updated the retail sales indicator, illustrating the recent weakness:
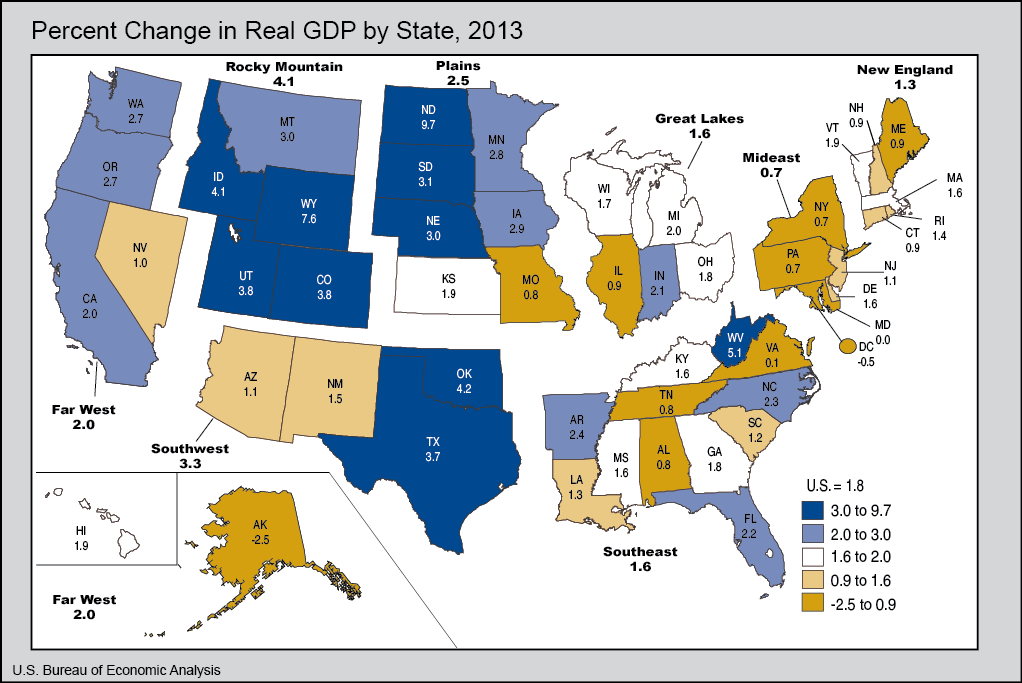
Where is the US economy growing? Vox has a state-by-state breakdown. Perspectives might differ accordingly.
The Week Ahead
We have a very big week for economic news and data.
The “A List” includes the following:
- Core PCE Prices (Th). Given the buzz over CPI and Yellen, the Fed’s favorite indicator makes the “A list.”
- New home sales (T). May data. Housing remains a big question mark for the rebound in the US economy.
- Initial jobless claims (Th). Best concurrent read on employment.
- Personal income and spending (Th). Important growth component.
- Consumer confidence (T). The Conference Board version informs about employment and spending in a concurrent fashion.
- Michigan sentiment (F). Similar to the Conference Board in overall results, but uses a continuing panel as part of the survey.
The “B List” includes the following:
- Existing home sales (M). A good economic read, but less significant for growth than new home sales.
- Durable goods orders (W). A key coincident indicator.
- Case-Shiller home prices (T). This always gets attention, despite the lagging and narrow nature of the index.
- Q1 GDP (W). This is normally not interesting since in market terms it is ancient history. This week it will be newsworthy because of the expected revisions. Some believe that Q1 will go into the books with a 2% decline.
In the week after the FOMC meeting we can expect plenty of FedSpeak. Several appearances are on the calendar.
While the financial markets have adjusted to the current Iraq story, there is plenty of attention to any breaking news.
How to Use the Weekly Data Updates
In the WTWA series I try to share what I am thinking as I prepare for the coming week. I write each post as if I were speaking directly to one of my clients. Each client is different, so I have five different programs ranging from very conservative bond ladders to very aggressive trading programs. It is not a “one size fits all” approach.
To get the maximum benefit from my updates you need to have a self-assessment of your objectives. Are you most interested in preserving wealth? Or like most of us, do you still need to create wealth? How much risk is right for your temperament and circumstances?
My weekly insights often suggest a different course of action depending upon your objectives and time frames. They also accurately describe what I am doing in the programs I manage.
Insight for Traders
Felix grew a bit more cautious last week – fewer positive sectors, lower median score, and greater uncertainty. Our three-week forecast is still bullish, but it is a closer call. This week we were fully invested in three of the top sectors for our trading accounts.
You can sign up for Felix’s weekly ratings updates via email to etf at newarc dot com.
Here is some great advice for traders from Ryan Detrick, one of our favorite sources. He lists ten things he has learned in his decade of trading experience. The list reflects my own experience and also the behavior of the best traders I know. It is difficult to pick a favorite, so you should read them all. Forced to pick one, I choose “There’s no wrong way to make money…..If you are lucky enough to find one thing you are good at, do it and perfect it.”
Insight for Investors
I review the themes here each week and refresh when needed. For investors, as we would expect, the key ideas may stay on the list longer than the updates for traders. The current “actionable investment advice” is summarized here.
The market still did not provide much opportunity for fresh buys. The gentle upward action is fine for long-term investors and excellent for those trying out our Enhanced Yield approach.
Here are some key themes and the best investment posts we saw last week:
Beware of “liquid alternative” funds. Jason Zweig’s must-read column, The Intelligent Investor, covers this story in the context of a recently failed fund. These investments might be a good fit, but be careful! Jason writes:
Liquid-alternative funds generally offer the prospect of doing well when U.S. stocks do poorly. That hope comes at a price, however: Such funds, which tend to charge high fees, typically do poorly when U.S. stocks do well. Investors who don’t understand this link will inevitably be sorry.
Tadas Viskanta, who writes Abnormal Returns (which is universally used to keep track of important events in the financial blogosphere) is taking his annual brief and well-deserved vacation. He solicits some comments on important questions, and publishes the results during his week off. These are all great reads, full of links and ideas. Here is the advice for novice investors (which has value even for those with experience). And here are great suggestions about what to read. Only Tadas could create so much content while taking time off!
Bond funds are a continuing source of risk. Is there really consideration of an “exit fee?” I rather doubt it, and also question whether it would work. The very idea of this discussion is something of a warning. (Barron’s). People expect these investments to represent the safe part of their portfolio. If we really do get the inflation that the Fed is seeking, interest rates will rise and bond prices will fall.
If you are worried about possible market declines, you have plenty of company.
Final Thought
Writing about inflation is a thankless task. Readers begin by thinking they know all of the answers. We all shop, right? It is the most popular subject for bamboozling people, since it is easy to find examples of rapidly rising prices. It is by far the most deceptive trap for those who might confuse politics with investing.
You have a simple choice:
- You can reinforce your beliefs and take joy in how stupid our leaders are. You and your favorite blogger, pundit, Congressional candidate, etc. have all of the answers. You are all smarter than the isolated, ivory-tower academics at the Fed. Please note that this was the trap that ensnared leading experts and wise observers like John Hussman and the ECRI – just to mention two of the most prominent examples who have had disastrous results over the last few years.
- You can accept the fact that the Fed has the power to set policy. It is wiser and more profitable to understand what they are doing and just go with the flow. You can grumble with your friends at the bar, vote your conscience at elections, and still profit from your investments.
I have been extremely accurate in my Fed forecasts, but I am not claiming any prizes. It has not been difficult. I simply read information carefully and understand that it is a committee at work. Here are the key takeaways. You will disagree. You will hate them all. Keep reminding yourself that even if you are right and Yellen is wrong, you will lose on your investments. The Fed has the power. Figure out how to use the knowledge to your advantage.
- The Fed is attempting to increase inflation. They seek 2% on the PCE index. This runs about 0.5% cooler than the CPI.
- The Fed does not measure inflation through commodity prices.
- The Fed believes that 2% is price stability. They think that traditional measures overstate inflation. They do not subscribe to ShadowStats (and neither do any of the people they respect). They also see a touch of inflation as easier to fix than deflation. They bias is toward stimulus.
- The Fed will tolerate as much as 2.5% inflation (on the PCE index) for a time.
- The Fed has a dual mandate – inflation and employment. It does not protect savers or emerging markets. Learn to live with it and ignore pundits who think this is important.
- The Fed sees food and energy as noisy components of inflation – wild movements that do not relate to the dual mandate. If food prices are up because of a drought or disease in hog herds, how could this be controlled by raising interest rates? Middle East geopolitics and oil? Same question. These price changes are certainly real, but they are volatile and not relevant for policy.
- The Fed does not shift policy based upon small monthly changes in data. Longer trends are demanded.
The conclusion is that Fed policy is on a relatively stable course, but data dependent. The market does not like this, since the preference is for certainty.
If you think about it, even just a little, you can see an obvious edge for investors. You need only accept the reality of the obvious course of policy and ignore the pundits. The Fed has always succeeded in creating inflation – eventually. It will happen again, but given the overall economic weakness it is taking longer. My current guess is late in 2016 or so. Meanwhile, there are some profitable investments to enjoy.
Monitor data, not pundits.

