How do you react to the unexpected?
Many are paralyzed by surprising information, especially when it seems very negative. Is it time to reduce risk, or is it a time of opportunity?
Housing data dominate this week, but I covered that story quite recently and there is not much to add. (The housing rebound story in the former piece is worth a look).
Since there was no fresh, definitive theme for this week, I had chosen the importance of planning as my topic. As occasionally happens, events developed quickly and I decided to include the Cyprus situation as a case in point. The immediate reactions covered a wide spectrum. Some observers saw the proposal to levy a tax on bank deposits as evidence that the European Union was about to unravel. At the other extreme, some accepted that this was a highly unusual situation which had no implications for any other country. The opinions mostly reflected the existing public postures of the various sources.
Confronted with this news of a fresh crisis, what should you do? You are not an expert on Europe or banking systems and certainly not on the internal political dynamics of the proposed bailout. Did your contingency plan help you with this problem?
I have some thoughts which I'll report in the conclusion. First, let us do our regular update of last week's news and data.
Background on "Weighing the Week Ahead"
There are many good lists of upcoming events. One source I especially like is the weekly post from the WSJ's Market Beat blog. There is a nice combination of data, speeches, and other events.
In contrast, I highlight a smaller group of events. My theme is an expert guess about what we will be watching on TV and reading in the mainstream media. It is a focus on what I think is important for my trading and client portfolios.
This is unlike my other articles, where I develop a focused, logical argument with supporting data on a single theme. Here I am simply sharing my conclusions. Sometimes these are topics that I have already written about, and others are on my agenda. I am putting the news in context.
Readers often disagree with my conclusions. Do not be bashful. Join in and comment about what we should expect in the days ahead. This weekly piece emphasizes my opinions about what is really important and how to put the news in context. I have had great success with my approach, but feel free to disagree. That is what makes a market!
Last Week's Data
Each week I break down events into good and bad. Often there is "ugly" and on rare occasions something really good. My working definition of "good" has two components:
- The news is market-friendly. Our personal policy preferences are not relevant for this test. And especially -- no politics.
- It is better than expectations.
This was another good week for economic data. We'll provide an abbreviated look at the most important results.
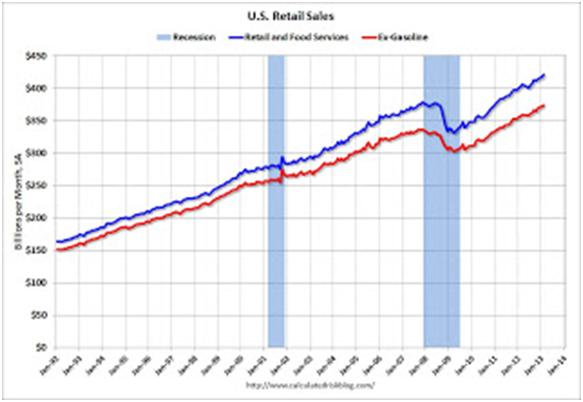
- Retail sales were much stronger than expectations, rising 1.1% in February and 4.6% year-over-year. Calculated Risk has a good account including this helpful chart:

- Initial jobless claims drifted still lower to 332K. This is a promising indicator for net jobs growth.
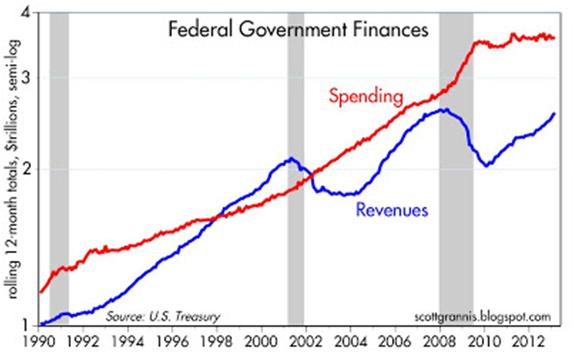
- The Federal Budget Deficit has declined by almost one-third in the past three years (via Scott Grannis).

The Bad
There was a little bad news. Here are the items that I find of greatest concern.
- Growth in the money supply, as measured by M2, is faltering. The Bonddad Blog notes that M2 has declines 0.7% from the recent peak. Continuing expansion is necessary to maintain conditions for economic growth. Ignore those who keep harping on the "monetary base" and focus instead on the actual money supply – a current concern.
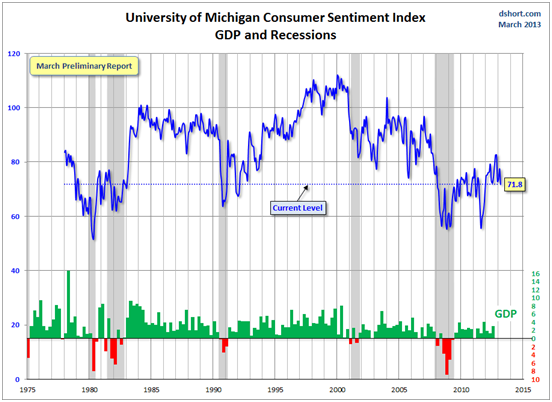
- Michigan consumer sentiment took a nosedive. The reasons can be a combination of higher fuel prices, the end of the payroll tax relief, Washington shenanigans, and negative headlines. My concern is that this indicator is often related to both consumption and employment. Have the emotional aspects detached from the economic reality? It is too soon to tell, but I am watching closely. Here is my favorite chart from Doug Short, who notes that the indicator is at recession levels:

The Ugly
European policymakers and the Cyprus situation handily win this week's "ugly" award. Even though the country involved is small, the potential for a larger problem is there. Europe needs to create and maintain confidence in the banking system, with comprehensive and believable insurance. The potential for a bank run is an important destabilizing force. The immediate effects are greater than the tax revenue raised.
The Indicator Snapshot
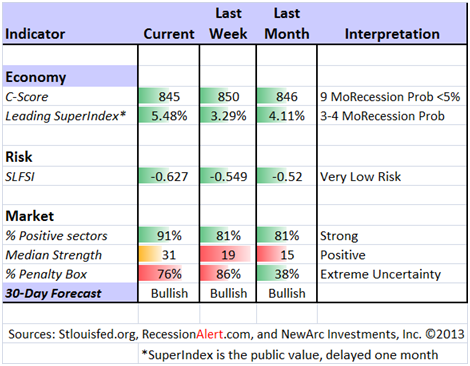
It is important to keep the current news in perspective. My weekly snapshot includes the most important summary indicators:
- The St. Louis Financial Stress Index.
- The key measures from our "Felix" ETF model.
- An updated analysis of recession probability.
The SLFSI is not a market-timing tool, since it does not attempt to predict how people will interpret events. It uses data, mostly from credit markets, to reach an objective risk assessment. The biggest profits come from going all-in when risk is high on this indicator, but so do the biggest losses.
The C-Score is a weekly interpretation of the best recession indicator I found, Bob Dieli's "aggregate spread." I have now added a series of videos, where Dr. Dieli explains the rationale for his indicator and how it applied in each recession since the 50's. I have organized this so that you can pick a particular recession and see the discussion for that case. Those who are skeptics about the method should start by reviewing the video for that recession. Anyone who spends some time with this will learn a great deal about the history of recessions from a veteran observer.
I have promised another installment on how I use Bob's information to improve investing. I hope to have that soon. Anyone watching the videos will quickly learn that the aggregate spread (and the C Score) provides an early warning. Bob also has a collection of coincident indicators and is always questioning his own methods.
I also feature RecessionAlert, which combines a variety of different methods, including the ECRI, in developing a Super Index. They offer a free sample report. Anyone following them over the last year would have had useful and profitable guidance on the economy. Dwaine Van Vuuren also has an excellent data update, demonstrating how the coincident data have reduced recession prospects. There are seven sample reports available, including Dwaine's latest country-by-country analysis of the global recession status. Good reading!
Georg Vrba is a great "quant guy" with an excellent variety of useful tools, some available via a free subscription. His take on a possible recession? Based upon unemployment data, the ECRI is wrong.
Doug Short has excellent continuing coverage of the ECRI recession prediction, now well over a year old. Doug updates all of the official indicators used by the NBER and also has a helpful list of articles about recession forecasting. His latest comment provides a detailed critique of the most recent ECRI media blitz, suggesting that it is "an effort to salvage credibility in hopes that major revisions to the key economic indicators -- notably the July annual revisions to GDP -- will validate their position." Read the entire post for full details. Doug also continues to refresh the best chart update of the major indicators used by the NBER in recession dating.
Readers might also want to review my Recession Resource Page, which explains many of the concepts people get wrong.

Our "Felix" model is the basis for our "official" vote in the weekly Ticker Sense Blogger Sentiment Poll. We have a long public record for these positions. About a month ago we switched to a bullish position. These are one-month forecasts for the poll, but Felix has a three-week horizon. Felix's ratings stabilized at a low level and improved somewhat over the last few weeks. The penalty box percentage measures our confidence in the forecast. A high rating means that most ETFs are in the penalty box, so we have less confidence in the overall ratings. That measure remains elevated, so we have less confidence in short-term trading.
[For more on the penalty box see this article. For more on the system ratings, you can write to etf at newarc dot com for our free report package or to be added to the (free) weekly ETF email list. You can also write personally to me with questions or comments, and I'll do my best to answer.]
The Week Ahead
This week brings little data and scheduled news, an artifact of the calendar and the holidays.
The "A List" includes the following:
- Initial jobless claims (Th). Employment will continue as the focal point in evaluating the economy, and this is the most responsive indicator.
- Leading economic indicators (Th). This is still a favorite for some.
- Existing home sales (Th). This is a key element of the economic rebound, so it is important to follow.
- Building Permits (T). The best leading indicator for housing.
- FAFA home prices (Th). These are the prices from the regular homes in the government market.
- FOMC decision (W). Not as important as usual since we seem to have the full story already.
Trading Time Frame
Felix has resumed a bullish posture, now fully reflected in trading accounts. For the last few weeks we have had conservative and partial trading positions. Since we only require three buyable sectors, the trading accounts look for the "bull market somewhere" even when the overall picture is neutral. Felix has been cautious, but still has caught most of the rally, and done so with less risk.
Investor Time Frame
Each week I think about the market from the perspective of different participants. The right move often depends upon your time frame and risk tolerance.
Buying in times of fear is easy to say, but so difficult to implement. Almost everyone I talk with wants to out-guess the market. The problem? Value is more readily determined than price! Individual investors too frequently try to imitate traders, guessing whether to be "all in" or "all out."
This approach would be especially poor right now!
Warren Buffett recently spent a few hours on CNBC's Squawk Box. As regular readers know I use TIVO and mute to find the best stories from this source. CNBC helped with some highlights – only nine well-spent minutes and you can see the best of the Buffett advice.
I was struck by this comment. Mr. Buffett said that the market offered you a quote on your holdings every day. This should be an advantage, but most people made poor use of it by trading at the wrong times. They would be better off to check on their portfolio every five years or so! It explains why most people make big mistakes in trying to time the market.
So do most "experts." I exposed the false claims of many pundits. You can check out the overall issue and also pundit ranks by reading The Seduction of Market Timing.
While there are no miracles available from market timing, you can definitely improve your risk/reward balance.
I strongly believe that active management can help investors. My concepts emphasize limiting risk and finding the right themes, not trying to time the markets via watching headlines. I really tried to pull this together here. This covers some key investor catalysts, as well as some specific stock and sector ideas. My recommendations did well last year, and we are off to another good start. You need to be comfortable in taking the other side of one of the most hated rallies in history.
But please beware! General ideas are not for everyone. Each person needs unique treatment. We have several different approaches, including one that emphasizes dividend stocks with enhanced yield from writing near-term call options.
We have collected some of our recent recommendations in a new investor resource page -- a starting point for the long-term investor. (Comments and suggestions welcome. I am trying to be helpful and I love feedback).
Final Thought
The most successful people in any field depend upon planning and preparation. Your favorite sports team has many hours of practice on every situation. If you are a trader, you need to do the same. There is not enough time to react – unless you have a plan!
Suppose you have been waiting for a market correction – a dip to buy. How much of a dip do you need? Here are some possibilities:
- Do some buying whenever there is a decline of 1% or more. Just a little, planning to scale into a full position.
- Wait for a 5% move before the initial buy.
- Expect a significant correction, so wait until there is a decline of at least 10% and a change in sentiment.
Those who are underinvested have a basically negative viewpoint on market fundamentals: valuation, economics, earnings – you name it. When news creates a dip, it seems to confirm their fears.
My Plan
My preparation begins with an analysis of risk and fundamentals, something that I write about each week. When there is a "crisis" in a country of one million people, I put it in perspective. In this case, the actual policy had not even been adopted, and it might not be. I might disagree with European officials (and I do) on the merits of this particular plan, but I recognize that it is a baby step, and a tentative one at that. See this analysis by John Dessauer (with special expertise on European banking) via Mark Hulbert.
"(He)…has little doubt that those bankers over the weekend learned their lesson. He's confident that they will very soon come up with some other plan that bails out weak Cyprus banks without imposing a deposit tax or some other haircut on bank deposits. Those central bankers now realize that the alternative to coming up with that solution is simply intolerable.
How soon will the European central bankers come up with their plan to resolve this crisis? By Wednesday or Thursday at the latest, and perhaps even sooner than that, Dessauer suspects. And when it does, the euro will quickly recover."
With that basic concept in mind, my own approach is to adhere to plan #1 for new accounts. Since I see many attractive stocks on a value basis, I start with positions of 35-40% of our target. When there is a dip, I add a little.
For our enhanced yield accounts a day such as we saw yesterday provides a great opportunity. Stocks move lower and volatility increases. This is the best time to buy a good dividend stock and sell a near-term call to enhance yield.
Taking any of these actions requires preparation. You have to have a "buy list" of ideas and target prices. You also need to be able to distinguish between scary headlines and something that is really important.
No one really knows whether the market will trade lower for the rest of this week or next. Are you prepared? Do you have a plan?
