Market Movers: Weekly Technical Outlook
Technical Developments to Watch:
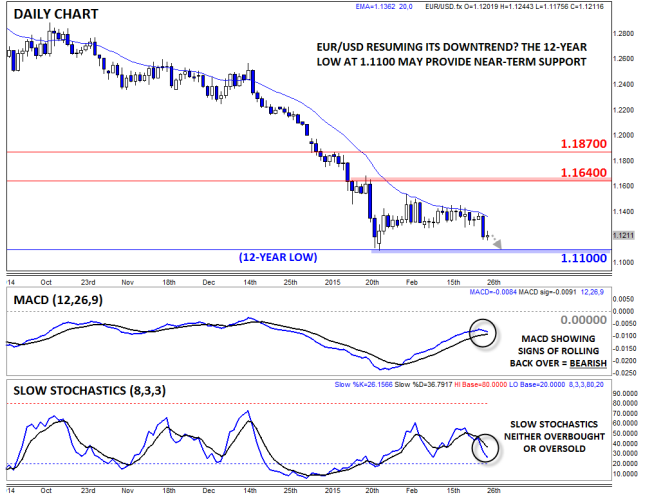
- EUR/USD approaching 12-year low at 1.1100
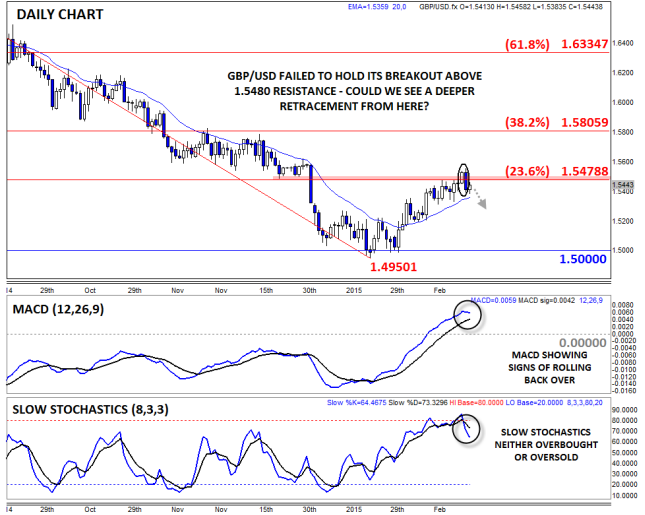
- GBP/USD failed to hold the breakout above 1.5480 resistance – bias bearish below there
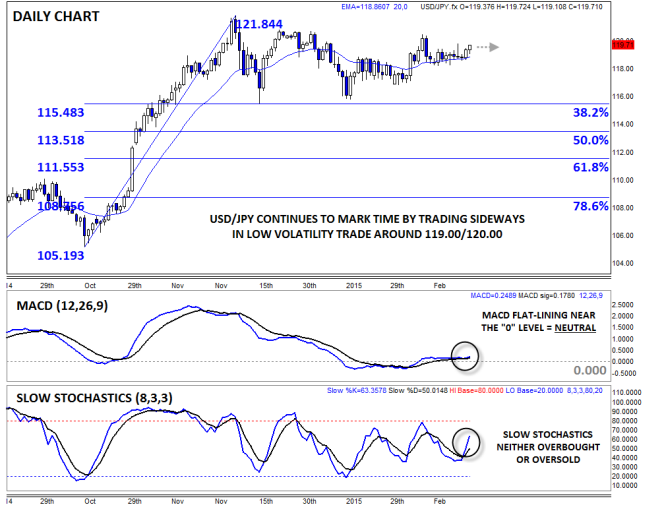
- USD/JPY’s lackluster trade continues in the 119.00-120.00 range
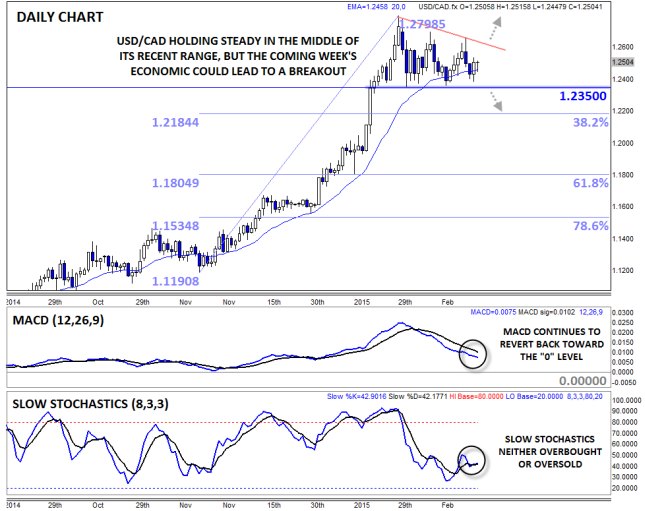
- USD/CAD in play, breakout likely on economic data deluge

* Bias determined by the relationship between price and various EMAs. The following hierarchy determines bias (numbers represent how many EMAs the price closed the week above): 0 – Strongly Bearish, 1 – Slightly Bearish, 2 – Neutral, 3 – Slightly Bullish, 4 – Strongly Bullish.
** All data and comments in this report as of Friday’s European session close **
EUR/USD

- EUR/USD collapsed as the dollar strengthened broadly on Thursday
- The secondary indicators are both showing signs of rolling over
- The bias has shifted to the downside for a possible retest of the 12-year low at 1.11
We often note that one of the strongest signals in trading is when an instrument fails to act “as expected” to a major fundamental development. As an example, EUR/USD was unable to rally despite a breakthrough in the Greek debt negotiations last week, which served as a clear warning that the pair was vulnerable to another leg lower. After Thursday’s big drop, the sellers have taken the upper hand once again, and unless Europe sees a series of unexpectedly strong fundamental reports this week, a continuation down toward the 12-year low at 1.1100 could be in play this week.
Source: FOREX.com

- GBP/USD failed to hold the breakout above its 23.6% Fibonacci retracement at 1.5480 last week
- MACD and Slow Stochastics showing signs of rolling over
- Thursday’s Bearish Engulfing Candle points to a possible pullback from here
GBP/USD bulls suffered a big setback last week when they were unable to maintain Wednesday’s break above the 23.6% Fibonacci retracement at 1.5480. Thursday’s large Bearish Engulfing Candle* showed a near-term shift from buying to selling pressure and suggests that rates may dip further heading into this week. While they’re still bullish on an absolute basis, both the MACD and Slow Stochastics are showing signs of potentially rolling over back to the downside, so a deeper retracement toward 1.5300 or lower would not be surprising early this week. On the other hand, a recovery back above the 1.5480 would put the bulls back in control.
*A Bearish Engulfing candle is formed when the candle breaks above the high of the previous time period before sellers step in and push rates down to close below the low of the previous time period. It indicates that the sellers have wrested control of the market from the buyers.
Source: FOREX.com
USD/JPY

- USD/JPY continued to consolidate in its recent range last week
- MACD and Slow Stochastics show balanced, two-way trade
- Near-term resistance sits up at 120.50, with support at 118.25
Given the lack of market movement over the last week, we’ve reproduced the previous report’s analysis nearly verbatim: USDJPY continued its slow, consolidative trading conditions around the 119.00 handle last week. As it stands, bulls and bears are in an almost perfect equilibrium, with neither side able to make any progress for the last few months now. Not surprisingly, the secondary indicators are showing balanced, two-way trade, providing little guidance on what to expect moving forward. In these types of markets, the best strategy for traders is generally to take their cue from the market – a break above 120.50 resistance could signal a bullish breakout, while a drop below last week’s low at 118.25 would point to a deeper pullback.
Source: FOREX.com
USD/CAD

- USD/CAD bounced around in the mid-1.20s last week
- MACD continues to pull back toward the “0” level as the previous bullish momentum evaporates
- Break from near-term consolidation pattern could signal next trend in the North American pair
USD/CAD is our currency pair in play this week due to a number of high-impact economic reports out of the US and Canada, including Friday’s dueling employment reports (see “Data Highlights” below for more). Last week, the pair bounced around in its recent range in the mid-1.20s, but this week’s deluge of economic data could take rates out of the near-term sideways range. A break below support at 1.2350 could open the door for a deeper retracement toward 1.2185, while a bullish breakout could target 1.2800 or higher in the coming weeks.
Source: FOREX.com
AUD Shouldn’t Expect Any Help from the RBA
It’s going to be such an eventful week for the Australian dollar that it may set the tone for weeks to come. There is a deluge of economic data due from Australia, China and the US, as well the constant threat of the storm clouds hanging over Europe. The most important event for the Australian dollar however, will be Tuesday’s monetary policy meeting at the Reserve Bank of Australia (RBA).
To Cut or Not to Cut
There is even more uncertainty surrounding this week’s policy meeting than there was in the days prior to the RBA’s meeting in February. At that meeting the RBA decided to move the official cash rate for the first time since July 2007. It was a line ball decision that could have easily resulted in the bank remaining on hold, as opposed to lobbing 25bps off the cash rate. Inevitably, the RBA decided that the Australian economy required more stimulus and the benefits of a lower OCR outweighed the threat of a bubble in residential property prices.
This time around the RBA must decide if even more stimulus is needed in light of some soft economic data and heightened concern about Australia’s growth and inflation outlooks. One of the most concerning pieces of economic data was Australia’s labor market report for January. Australia’s unemployment rate unexpectedly jumped to 6.4% in January (expected 6.2%) from 6.1% in December as 28.1K full-time jobs disappeared. Despite the possibility that this data was somewhat distorted by statistical volatility, it was still enough to spark calls for back-to-back interest rate cuts.
However, as the shock of the employment numbers began to wear off, the market slowly began to discount the idea that the RBA would loosen policy further in March. That was until the release of Australia’s private capital expenditure figures for last quarter. Private capital expenditure fell 2.2% last quarter, missing an expected 1.6% drop, and investment intentions for the year also underwhelmed expectations.
Not a Question of If, but When
Even prior to this deluge of disappointing economic data the RBA’s own quarterly report indicated that it was anticipating the need for further monetary policy loosening, despite a lower Australian dollar and some reservations about the diminishing effectiveness of lower interest rates. So, it’s really not a question of if the RBA will cut another 25bps off the official cash rate, but when. After last week’s disappointing CAPEX figures, the market is pricing in just over a 50% chance of lower interest rates in March, at least according to the OIS market. Most market commentators, including FOREX.com, are a little more confident that the RBA will cut the official cash rate to 2.00% on Tuesday.
What Does this Mean for the Australian Dollar?
The uncertainty regarding the outcome of this week’s policy meeting at the RBA means that we may see some big moves in the Australian dollar on the back of the bank’s decision, no matter what it decides. As we have previously stated, we put a higher probability on the RBA cutting the OFC than leaving it unchanged, which may keep AUD/USD on the back foot.
There is the possibility that the RBA may maintain an almost-neutral bias and cut interest rates to 2.00% due to the diminishing ability of further policy loosening to effectively support growth and inflation outcomes. Yet, this would be dangerous for the bank’s outlook for an even weaker Australian dollar, as it may place a matching floor on AUD weakness. The most effective strategy would be for the RBA to adopt at least a slight easing bias if it cuts interest rates, keeping the door open for further AUD downside. In the event it does this, AUDUSD may break out of its medium-term upward trend and begin a push towards its 5.5-year low around 0.7625.
Other Economic Data to Watch When Trading AUDUSD
Australia | USA | China | |
1-Mar | TD Securities Inflation Index | Manufacturing PMI (exp. 49.8) | |
2-Mar | Commodity Index | ISM Manufacturing PMI | HSBC Manufacturing PMI (exp. 50.1 |
3-Mar | Building approvals; current account; RBA Rate statement | ||
4-Mar | GDP | ISM Non-Manufacturing PMI; Beige Book | |
5-Mar | Retail sales; trade balance | Unemployment claims; revised non-farm productivity | |
6-Mar | NFP; trade balance; unemployment rate |
Note: release dates assume GMT
Look Ahead: Equities
This week saw some of the major European and US stock indices rally to fresh unchartered territories while others hit multi-year highs. In the US, the Federal Reserve Chairwoman Janet Yellen laid the groundwork for a gradual rate hiking cycle, although at the same time made it clear that there won’t be any rate rises in the next couple of meetings. This kept both the dollar and stock market bulls happy. Sentiment was also lifted by news Greece’s bailout program was finally extended and after the release of some stronger than expected Eurozone data. What’s more, it has been a decent earnings season in Europe so far too. We are now about two-thirds of the way into Europe's earnings season. According to Reuters, some 55% of companies here have met or beaten profit forecasts. The overall quarterly earnings are expected to grow by 19.5%, which, if correct, would be Europe's best season in 3.5 years. Indeed, as we have been going on about it for some time now, it is the European markets where we are likely to see most of the action in the coming weeks. The ECB’s recent introduction of QE is the primary reason for our bullish view on the European markets. If the US is anything to go by then the European stock markets have a lot of catching up to do as the ECB’s actions push bond yields further lower and, in some cases, into the negative territory. Yield-seeking investors are being left with little choice but to invest into the stock markets as the returns on other investments are simply too low or come with undesirably high risks. But we have also seen the release of some decent economic data from the single currency block in recent times and if this trend continues next week then we could see further gains in the European stock markets.
As we have already published some bullish reports on the FTSE 100, CAC 40, DAX and DJ Euro Stoxx 50 recently, our featured chart for this week is the IBEX 35 index. Below we have two charts of the Spanish benchmark index, both displaying clear bullish patterns. The monthly chart shows that the IBEX has been in an upward trend since bottoming out in 2012. In recent months, the index has consolidated in a relatively tight range below the 11200 handle, suggesting that it may be gearing up for a potential breakout towards the long-term 61.8% Fibonacci retracement level of the downswing from the 2007 crash, around 12160. On the daily chart, one can see that it has recently broken above its main moving averages and also a bearish trend line. The breakout was confirmed once the prior high around 10745 was cleared (area circled on the chart). It has since been moving higher and is now not too far off that 11200 handle. A decisive break through this level could target 11750/60. This is where the 127.2 and 161.8 per cent Fibonacci extension levels of the last two downswings converge. From there, it may pullback a little bit on profit-taking before potentially pushing higher again towards that long-term 61.8% Fibonacci level (see the monthly chart). Meanwhile a potentially bearish scenario would be if the index fails to crack this 11200 yet again. But the bulls will only be concerned if the index also goes on to break support at 10930. If it does, then it may push back towards 10745 before deciding on its next move.
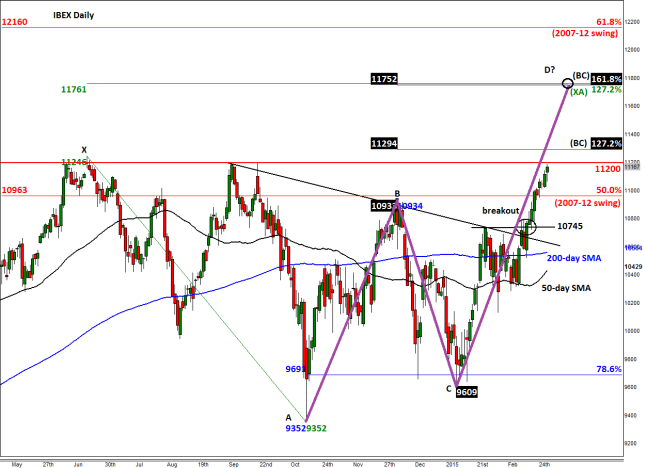
Source: FOREX.com. Please note this product is not available to US clients
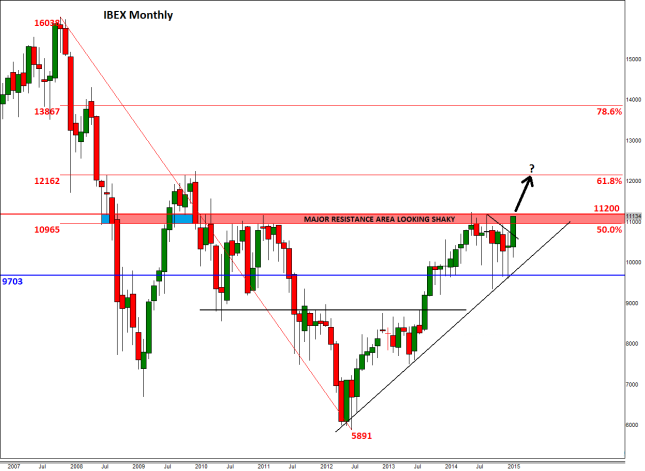
Source: FOREX.com. Please note this product is not available to US clients
Look Ahead: Commodities
As we went to press on Friday afternoon, crude oil was trading higher: at a good $61 a barrel, Brent was also higher on the week but WTI was down as it hovered around the $49 level. The price differential between these two oil contracts had therefore grown to $12, the widest since January 2014. The widening of the price gap in part reflects the fact that the US oil output has continued to grow relentlessly despite the much weaker prices recently. This has helped to push crude stockpiles to repeated all-time highs, which more or less confirms that the market is still oversupplied. As the Energy Information Administration’s (EIA) latest data shows, crude inventories grew by some 8.4 million barrels last week. This was the seventh consecutive weekly increase; stocks have grown by more than 50 million barrels during this time, pushing the total to 434.1 million barrels. However there was some good news as both gasoline and distillate stocks decreased sharply last week, by a good 3.1 and 2.7 million barrels respectively. This actually caused WTI oil prices to recover somewhat in mid-week and prevented a larger decline for the week as a whole. Meanwhile, the current economic conditions do not point to a marked improvement in oil demand, so any notable recovery that we may see will mostly be due to the supply side of the equation. On this front, Baker Hughes (NYSE:BHI)’ rig count data, released on Fridays, and the usual weekly inventories reports, on Tuesdays and Wednesdays, will be among the best indicators about the future production levels. Last week, the falls in rig counts were noticeably lower compared to recent times. If this trend continues then WTI may struggle to recover much further than it already has, as nothing has been done about the supply glut in the short-term which continues to exert strong downward pressure on prices.
In contrast, Brent looks more constructive. There seems to be some disquiet among the OPEC after Nigeria’s oil minister, Diezani Alison-Madueke, who is also the current president of the OPEC, recently said that further price volatility would make it “highly likely that I will have to call an extraordinary meeting of OPEC in the next six weeks or so.” This has increased speculation that the cartel may after all cut back its production quota and thus concede some market share to shale producers. However if this is dismissed, Brent could potentially fall back significantly as investors price out the probability of a production cut.
The daily chart of Brent shows a potentially technical bullish development following this week’s rally off the $58.50/$59.00 support area. As can be seen, this area was previously resistance and it also corresponds with the 23.6% Fibonacci retracement level of the recent upswing. As this is a particularly shallow retracement level, it points to potentially large gains next week IF resistance around $63.00 breaks. However if the bears win this particular battle then we may see a sizeable pullback towards some of the support levels shown on the chart, with the first such level being the 38.2% retracement at just above $56. Meanwhile the chart of WTI shows a completely different picture. After creating a triple top reversal pattern early last week at $54.00, it has generally traded lower. Though it has found some support around $48.75, the short-term bias would only turn bullish upon a decisive break above resistance at $51.
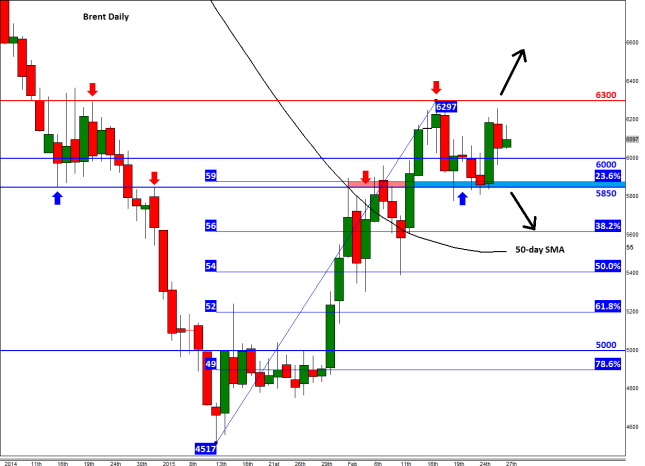
Source: FOREX.com. Please note this product is not available to US clients.
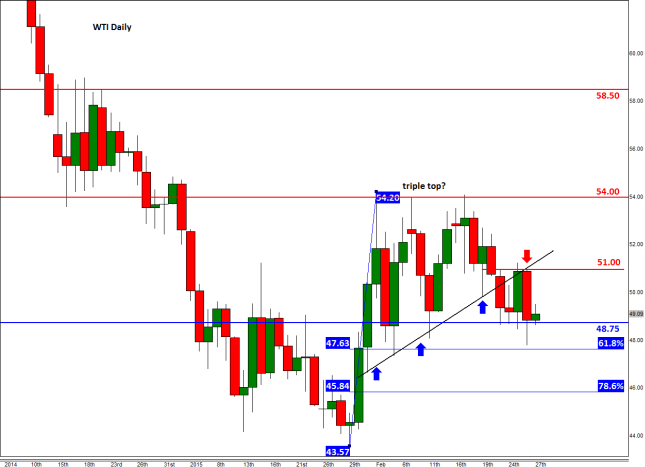
Source: FOREX.com. Please note this product is not available to US clients
Global Data Highlights
Monday, March 2, 2015
1:45 GMT HSBC Chinese Final Manufacturing PMI (February)
There was a bit of good news from the Flash reading of this release which showed a jump back above the 50 level, indicating that there was growth in the sector. The previous two months had fallen below 50, so the fear of a slowdown for the Asian Giant was becoming justified. If this final release can maintain the positive correlation, the Chinese freakout may have to wait for another release that doesn’t live up to expectations.
10:00 GMT Eurozone Flash Consumer Price Index (February)
A strange thing has happened in inflation over the last week or so as it hasn’t been as bad as originally assumed in many parts of the world. The most vital for this release was German CPI this past week that rose 0.1% YoY when negative figures were expected. If that momentum can carry over to the Eurozone, the EUR may find some strength despite it being one of the more despised currencies by investors.
Tuesday, March 3, 2015
1:30 GMT Japanese Labor Cash Earnings (January)
Much like the Average Hourly Earnings over in the US, this release has gained more attention for its inflationary impact. If people are making more money, they will typically have and spend more of that disposable income, which drives prices higher and leads to inflation. Since Japan has been stuck in a deflationary trap for much of the last couple decades, any signs of positive inflation are valued. Consensus is looking for a 0.6% increase which would be in-line with typical readings over the past year.
4:30 GMT Reserve Bank of Australia’s Interest Rate Decision and Statement
This will likely be the big market mover on this day as a majority of traders and analysts expect them to cut interest rates by 25 basis points. The AUD may lose some luster leading up to this release which opens up the possibility of a “buy the rumor, sell the news” dynamic, but in reverse. As more traders catch wind of the increased expectation of a cut, they could drive the AUD down, but if the RBA actually does what everyone anticipates, there may be no more AUD sellers to jump aboard leading to some profit taking and a rise in the AUD. Also, if they don’t cut rates, a blistering rally may unfold.
Tentative New Zealand Global Dairy Trade Price Index
Milk prices have increased for five straight releases of this bi-monthly report, and the NZD has rallied as a result. If the trend can continue, there may be no reason for the NZD to go anywhere but up, but if the RBA is indicating that future concerns for the region are imminent, cuts rates, and GDT misses, the NZD could fall significantly.
Wednesday, March 4, 2015
9:30 GMT Markit UK Services PMI (February)
Just like most developed economies, the UK is highly dependent upon the service sector for jobs and economic might. Consensus is expecting another decent number well above the 50 level as it has been since the beginning of 2013. Therefore there may not be much fanfare surrounding this event, but if it fails to achieve that preconceived level, the GBP may be due for a correction.
13:15 GMT ADP US Employment Change (February)
This is one of the most anticipated pre-NFP releases there are as it gives a very good indication to the direction of the all-important employment indicator. It’s no big secret that US employment has been super strong of late, so the market may be looking for any cracks in the foundation of a continued run. If ADP doesn’t produce at least 200k or more, the USD could take a beating as investors prepare for a less than stellar NFP.
15:00 GMT Bank of Canada’s Interest Rate Decision and Statement
BoC Governor Steven Poloz spoke this past week about “reinventing central banking” in Ontario and in his speech he mentioned that “insurance from the interest rate cut buys us some time to see how the economy actually responds.” Previous to that statement, most pundits expected the BoC to cut rates again, just like they did the previous month. However, now there is a little doubt creeping in as it appears Poloz is willing to observe the effects of his initial rate cut before taking action again. This could be a boost to the CAD which has been decimated over the past month against most other currencies.
15:00 GMT ISM US Non-Manufacturing PMI (February)
This is another widely followed report due to its relationship with NFP being released at the end of the week. The service sector is easily the largest provider of jobs for US citizens and the employment subcomponent of this release gives a good clue as to how NFP will turn out. If both ADP and this employment subcomponent indicate that there is a lull in hiring, anticipation of a bad NFP report could become the norm.
Thursday, March 5, 2015
12:00 GMT Bank of England’s Interest Rate Decision
Most likely the BoE will do absolutely nothing with their interest rate as the Monetary Policy Committee has turned more neutral than hawkish of late. However, UK economic data continues to be non-alarming, which opens up the slight possibility the MPC could switch back to slightly hawkish. However, the only way we find that out is when the votes are released, which isn’t with this decision. Remote as it may be for any changes to be made, we still need to pay attention to this decision as the chance of an interest rate hike would be an extremely important market moving event.
12:45 GMT European Central Bank’s Interest Rate Decision, Statement, and Press Conference
The legwork for the ECB was done last month as ECB President Mario Draghi introduced the Quantitative Easing program and drove the EUR/USD down below 1.11. Therefore, there may not be much to say that hasn’t already been said at this meeting. The more likely outcome would be that Draghi talks about the good the QE program could bring and the positive effects they may already be experiencing because of it. If Draghi delivers that message, there may be some room to rally in EUR crosses as they have been beaten down over the last month.
Friday, March 6, 2015
13:30 GMT US Non-Farm Payroll, Unemployment Rate, and Average Hourly Earnings
Everything else almost feels like noise leading up to the sound when it comes to this release at the end of the week. Attention being paid to this employment number almost seems to be increasing as the years have passed, and for good reason. Last month’s NFP release was ridiculously good as not only did the headline number beat expectation, previous figures were revised up, and average hourly earnings jumped too. The only blemish was the unemployment rate that went up 0.1%, but that was largely because more people entered in to the job searching arena. There have now been 11 straight months of 200k+ results, and consensus is expecting the 12th to happen this time around. No matter the result though, this release is bound to have an outsized impact on the market immediately as well as future implications of interest rates for the Federal Reserve down the road.
