Over the last two weeks we have had an avalanche of economic data – mostly good news. The market reaction has been mixed, because so much of the "hot money" has a Fed fixation. For much of the last two weeks, every piece of good economic news led to lower stocks, presumably because this would lead to a reduction in QE. Finally, the good payroll news on Friday got the opposite reaction.
The question for the coming week – and maybe the next few months – is will "good news" finally be good news? Put another way:
Will the fixation on the "T word" finally come to an end?
The media, increasingly catering to their trader audience, plays into the constant focus on the Fed. This allows everyone to join in, but it has not provided much actual help for investors.
I have some further thoughts in the conclusion. First, let us do our regular update of last week's news and data.
Background on "Weighing the Week Ahead"
There are many good lists of upcoming events. One source I regularly follow is the weekly calendar from Investing.com. For best results you need to select the date range from the calendar displayed on the site. You will be rewarded with a comprehensive list of data and events from all over the world. It takes a little practice, but it is worth it.
In contrast, I highlight a smaller group of events, including some you have not seen elsewhere. My theme is an expert guess about what we will be watching on TV and reading in the mainstream media. It is a focus on what I think is important for my trading and client portfolios. Each week I consider the upcoming calendar and the current market, predicting the main theme we should expect. This step is an important part of my trading preparation and planning. It takes more hours than you can imagine.
My record is pretty good. If you review the list of titles, it looks like a history of market concerns. Wrong! The thing to note is that I highlighted each topic the week before it grabbed the attention. I find it useful to reflect on the key theme for the week ahead, and I hope you will as well.
This is unlike my other articles, where I develop a focused, logical argument with supporting data on a single theme. Here I am simply sharing my conclusions. Sometimes these are topics that I have already written about, while others are on my agenda. I am putting the news in context.
Readers often disagree with my conclusions. Do not be bashful. Join in and comment about what we should expect in the days ahead. This weekly piece emphasizes my opinions about what is really important and how to put the news in context. I have had great success with my approach, but feel free to disagree. That is what makes a market!
Last Week's Data
Each week I break down events into good and bad. Often there is "ugly" and on rare occasions something really good. My working definition of "good" has two components:
- The news is market-friendly. Our personal policy preferences are not relevant for this test. And especially -- no politics.
- It is better than expectations.
The Good
Most of the recent news has been very good.
- China's PMI of 50.8 shows expansion and represents a new recent high.
- Congress seems to be nearing a deal on the budget. This will avoid another round of debt ceiling and shutdown crises, and it may even open the door to immigration reform. (See The Hill). It will not represent a "grand bargain" which might still be five years away. (See Stan Collender for ten reasons).
- GDP was stronger than expected in Q3. The revision was mostly the result of inventory buildup, which invites spinning. Bob McTeer is well aware of this issue. It all depends on whether the inventories represent intentional accumulation for anticipated sales, or disappointing current performance.
- Employment is improving. The weekly jobless claims hit a new low. The monthly employment situation report shows a nice rebound with growth in the household survey and a lower unemployment rate. We are still far from resuming trend growth, but it is an improvement and certainly belies any lingering recession worries. Scott Grannis has a nice summary, including a chart of both the major surveys. He also puts to rest the part-time employment argument, writing as follows:
Despite what you might have heard repeated many times in the media, jobs growth in the current recovery has not been dominated by part-time jobs. As the chart above shows, there actually has been zero growth in part-time jobs since the last recession, and the ratio of part-time to total jobs has been falling steadily, much as it has in every recession in the past.
ISM manufacturing was very strong. Dr. Ed analyzes the components.
Michigan sentiment was very strong. I view this as an important concurrent indicator both for employment and consumption. Doug Short's chart is my favorite and his analysis is excellent.


- Housing still looks good – new home sales and permits. See the authoritative work from Calculated Risk.
The Bad
There was not much bad news. Feel free to add suggestions in the comments. These should be items from the current week, not the repetition of something you could have said (and probably did) six months ago!
- Personal income disappointed, declining in real terms. See Steven Hansen's analysis.
- The ISM Services index was positive, but below expectations.
- Holiday sales were soft for some retailers – at least from the early reports.
- Investor sentiment remains very bullish, a contrarian short-term indicator. Bespoke charts the AAII data:
Silver Bullet
I occasionally give the Silver Bullet award to someone who takes up an unpopular or thankless cause, doing the real work to demonstrate the facts. Think of The Lone Ranger. Thanks to the many readers who wrote or commented suggesting that my analysis of the Morgan Stanley chart on forward earnings should be this week's winner. I cannot give myself the award, but I do urge readers who missed the article to take a look. It was like a movie that got critical acclaim but did not attract a big audience.
Ironically, the original chart I was analyzing pretty much went viral.
The Indicator Snapshot
It is important to keep the current news in perspective. I am always searching for the best indicators for our weekly snapshot. I make changes when the evidence warrants. At the moment, my weekly snapshot includes these important summary indicators:

- For financial risk, the St. Louis Financial Stress Index.
- An updated analysis of recession probability from key sources.
- For market trends, the key measures from our "Felix" ETF model.
Financial Risk
The SLFSI reports with a one-week lag. This means that the reported values do not include last week's market action. The SLFSI has recently edged a bit higher, reflecting increased market volatility. It remains at historically low levels, well out of the trigger range of my pre-determined risk alarm. This is an excellent tool for managing risk objectively, and it has suggested the need for more caution. Before implementing this indicator our team did extensive research, discovering a "warning range" that deserves respect. We identified a reading of 1.1 or higher as a place to consider reducing positions.
The SLFSI is not a market-timing tool, since it does not attempt to predict how people will interpret events. It uses data, mostly from credit markets, to reach an objective risk assessment. The biggest profits come from going all-in when risk is high on this indicator, but so do the biggest losses.
Recession Odds
I feature the C-Score, a weekly interpretation of the best recession indicator I found, Bob Dieli's "aggregate spread." I have now added a series of videos, where Dr. Dieli explains the rationale for his indicator and how it applied in each recession since the 50's. I have organized this so that you can pick a particular recession and see the discussion for that case. Those who are skeptics about the method should start by reviewing the video for that recession. Anyone who spends some time with this will learn a great deal about the history of recessions from a veteran observer.
I also feature RecessionAlert, which combines a variety of different methods, including the ECRI, in developing a Super Index. They offer a free sample report. Anyone following them over the last year would have had useful and profitable guidance on the economy. RecessionAlert has developed a comprehensive package of economic forecasting and market indicators. Their most recent report provides a market-timing update for those considering whether to "buy the dips."
Georg Vrba's four-input recession indicator is also benign. "Based on the historic patterns of the unemployment rate indicators prior to recessions one can reasonably conclude that the U.S. economy is not likely to go into recession anytime soon." Georg has other excellent indicators for stocks, bonds, and precious metals at iMarketSignals. His most recent update revisits Albert Edwards's year-old prediction that the Ultimate Death Cross was imminent. Georg refuted the claim at the time, and now takes a more complete look.
Unfortunately, and despite the inaccuracy of their forecast, the mainstream media features the ECRI. Doug Short has excellent continuing coverage of the ECRI recession prediction, now two years old. Doug updates all of the official indicators used by the NBER and also has a helpful list of articles about recession forecasting. Doug also continues to refresh the best chart update of the major indicators used by the NBER in recession dating. The ECRI approach has been so misleading and so costly for investors, that I will soon drop it from the update. The other methods we follow have proved to be far superior.
Readers should review my Recession Resource Page, which explains many of the concepts people get wrong.
Here is our overall summary of the important indicators.
Our "Felix" model is the basis for our "official" vote in the weekly Ticker Sense Blogger Sentiment Poll. We have a long public record for these positions. Over the last two months Felix has ranged over the full spectrum – twice! The market has been moving back and forth around important technical levels, driven mostly by news. The current values are still bullish, but only marginally so.
Felix does not react to news events, and certainly does not anticipate effects from the headlines. This is usually a sound idea, helping the trading program to stay on the right side of major market moves. Abrupt changes in market direction will send sectors to the penalty box. The Ticker Sense poll asks for a one-month forecast. Felix has a three-week horizon, which is pretty close. We run the model daily, and adjust our outlook as needed.
The penalty box percentage has decreased dramatically, meaning that we have more confidence in the overall ratings.
[For more on the penalty box see this article. For more on the system ratings, you can write to etf at newarc dot com for our free report package or to be added to the (free) weekly ETF email list. You can also write personally to me with questions or comments, and I'll do my best to answer.]
The Week Ahead
After the post-Thanksgiving data feast, we have a relatively thin week for new data.
The "A List" includes the following:

- Initial jobless claims (Th). Resuming a key role as the most responsive employment measure.
- Retail sales (Th). The consumer remains a focal point.
The "B List" includes:
- PPI (F). Inflation data remains tame, so this is not likely to move the markets.
The speechmaking schedule is still thin. James Bullard of the St. Louis Fed will speak on Monday. Secretary of State Kerry will testify before a Congressional Committee on Tuesday. We will also get more news on the developing budget deal.
How to Use the Weekly Data Updates
In the WTWA series I try to share what I am thinking as I prepare for the coming week. I write each post as if I were speaking directly to one of my clients. Each client is different, so I have five different programs ranging from very conservative bond ladders to very aggressive trading programs. It is not a "one size fits all" approach.
To get the maximum benefit from my updates you need to have a self-assessment of your objectives. Are you most interested in preserving wealth? Or like most of us, do you still need to create wealth? How much risk is right for your temperament and circumstances?
My weekly insights often suggest a different course of action depending upon your objectives and time frames. They also accurately describe what I am doing in the programs I manage.
Insight for Traders
Felix continues in bullish mode. In our trading accounts we have been fully invested and the positions have gradually become more aggressive. Felix's ratings have been in a fairly narrow range for several months. The rapid news-driven shifts are not the ideal conditions for Felix's three-week horizon. This week we see somewhat lower ratings, but more sectors in the penalty box. There are still three attractive sectors, but it would not be surprising to see a move toward "neutral" in the week ahead.
Felix gets credit for identifying biotech (IBB) and riding the wave. This has been one of the top-rated choices in our free weekly email update (email address in the "Felix" section above.
Insight for Investors
I review the themes here each week and refresh when needed. For investors, as we would expect, the key ideas may stay on the list longer than the updates for traders. I am covering some detailed ideas and links in this section, but also see the conclusion.
There is a continuing barrage of "bubble talk." It seems like there is a drumbeat of stories with the same bearish themes, mostly relying on the Shiller CAPE P/E method of valuation and also the argument that profit margins are elevated. These are both rather old and tired arguments, but the refutation gets little publicity. Worried investors should take a few minutes to read these two sources:
Macro Man – analyzing a number of bearish arguments. The entire article is great, but let me focus on the issue of profit margins, where he writes as follows:
[Argument] Earnings as a percentage of GDP are too high. They will revert back to the long term mean, which means substantially lower profits.
That is only true if you look at TOTAL earnings. DOMESTIC earnings are NOT excessively high as a percentage of GDP. Much of the recent earnings growth over the past decade has actually come from abroad:
Jeremy Siegel, who has been absolutely right about the market, both for the very long term and for the current year. Advisor Perspectives Editor Robert Huebscher had a fine recent interview where Prof. Siegel explains why the market is 10-15% undervalued right now, and has the potential for working significantly higher. He especially responds to arguments based upon his friend Robert Shiller's CAPE ratio, profit margins, and Fed policy.
Here is a summary of current recommendations for the individual investor.

- Headlines. The challenge for investors is to distinguish between the major trends and the short-term uncertainty. The main themes are not related to headlines news, even though sentiment may drive market fluctuations. Do not be seduced by the idea that you can time the market, calling every 10% correction. Many claim this ability, but few have a documented record to prove it. Most who claim past success are using a back-tested model. Please see The Seduction of Market Timing.
- Risk Management. It is far better to manage your risk, specifically considering the role of bonds and the risk of bond mutual funds. As I emphasized, "You need to choose the right level of risk!" Right now, it is the most important question for investors. There is plenty of "headline risk" that may not really translate into lower stock prices. Instead of reacting to news, the long-term investor should emphasize broad themes.
- Bond Funds are Risky. Investors have been surprised at the losses, which will continue as the long end of the interest rate curve moves higher. You need to have the right mix of stocks to benefit from a rising rate environment.
- Stepping in gradually. If you are completely out of the market, you are not alone. Consider buying dividend stocks and selling calls against them. This strategy has been working great both for our clients and for many readers. (Thanks for the email responses!) This will work in a sideways market. You can also buy some stock in the sectors with the best P/E ratios.
And finally, we have collected some of our recent recommendations in a new investor resource page -- a starting point for the long-term investor. (Comments and suggestions welcome. I am trying to be helpful and I love feedback).
Final Thought
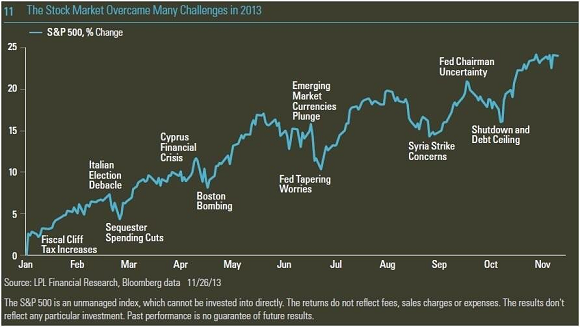
We are reaching the end of a year when many scary possibilities did not occur. Since these many scenarios weighed on stocks, it was natural to see a rally driven both by an improved economy and earnings as well as a reduction in fear. Those who attribute everything to Fed policy are simply making excuses for their bad forecasting as I noted in The Fed as a Fig Leaf.
The classic wall of worry concept, which you can learn more about on my investor page, was nicely illustrated by this chart from LPL Financial (via Cullen Roche).
If we had nothing to worry about, the Dow would already be at 20K, fulfilling my prediction. I am looking forward to a time of less emphasis on the Fed and more attention to market fundamentals.