Most realize something is broken in the current economy - and it is aggravating to listen to the litany of "information" pumped out in the media. The Fed continues to talk up the economy and continue to dangle the prospect of rate increases which suggests an almost healed and improving economy. Seems everything is getting rosy, and the only reason the economy is not doing better is because of the politicians as they are either spending too much or too little - or there is too much regulation.
And to listen to headlines - the consumer has returned to the consumption trough. The per capita consumer spending continues to grow.
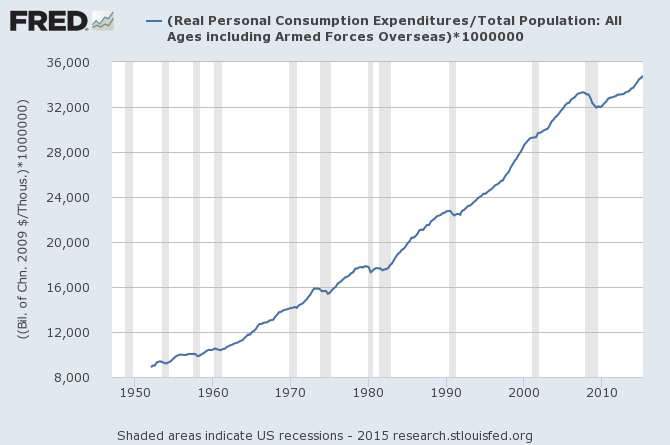
But unfortunately, this inflation adjusted picture distorts consumer spending. Literally half of consumer spending at the beginning of the Great Recession was on food and shelter. And BOTH food and shelter are now growing much faster than the inflation adjustments. Basically, Joe Sixpack, who was spending every penny on food and shelter at the beginning of the Great Recession, actually has less to spend in real terms on food and shelter - and likely little on anything else.
Note in the graph below, the inflation adjustment was removed from real median income so that it can be indexed against the growth of the CPI.
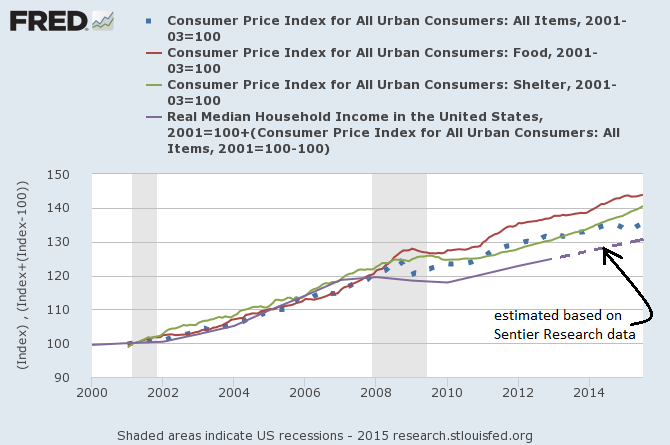
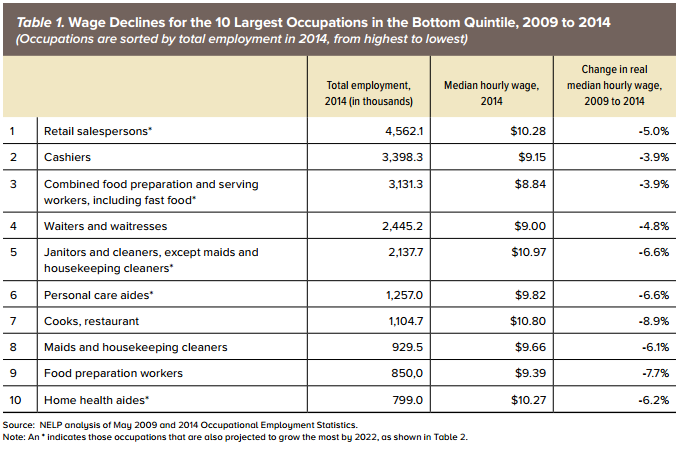
The point being made here is that the median consumer has yet to see an economic recovery. According to a study by the National Employment Law Project:
In summary, we find that real wage declines were greatest for the lowest-wage occupations. In the bottom quintile, restaurant cooks and food preparation workers experienced wage declines well in excess of the average for all bottom-quintile occupations and the entire occupational distribution. Real median wages fell by 5.0 percent or more in six of the ten occupations with the greatest projected job growth by 2022. Moreover, five of the ten highest-growth jobs were at the bottom of the occupational distribution in 2014, suggesting a future of continued imbalance.
Yet, the Fed believes the USA has an almost healed and improving economy. There is little evidence the lower half of consumers are participating in an improving economy.
And what about employment which is the other half of the Fed's dual mandate?
The headlines say unemployment is 5.1% - a very good level which is associated with times of economic expansion. But because of the criteria used to determine headline unemployment, headline unemployment does not determine labor slack. The U-6 (all in) unemployment rate (red line in graph below) is approaching but not yet at levels associated with times of economic expansion.
In the graph below, the yellow bars are periods where the Fed was raising their funds rate.
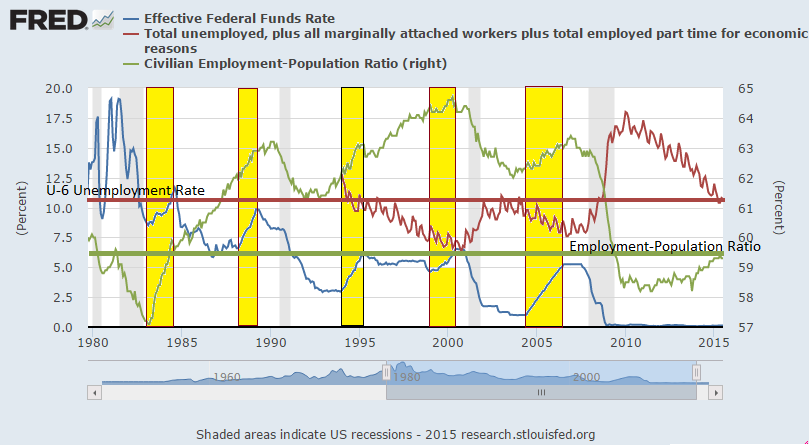
My position is that there remains significant labor slack. I am not a believer that there has been a demographic shift causing a lower employment-population ratio - as the employment-population ratio for people over 65 is at all-time highs. Simply put, many (most?) people do not have enough money to retire. The low employment-population ratio tells me there are a lot of folks out there who would work if they thought they could get a job.
Yet, the Fed believes the USA has an almost healed and improving economy
Other Economic News this Week:
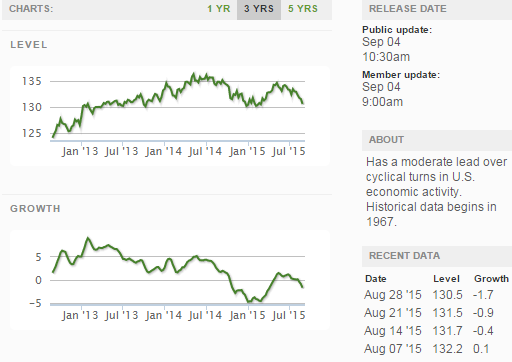
The Econintersect Economic Index for August 2015 declined to the lowest level since April 2010. The tracked sectors of the economy remain relatively soft with most expanding at the lower end of the range seen since the end of the Great Recession. Our economic index has been in a long term decline since late 2014.
The ECRI WLI growth index is now in positive territory but still indicates the economy will have little growth 6 months from today.
Current ECRI WLI Growth Index
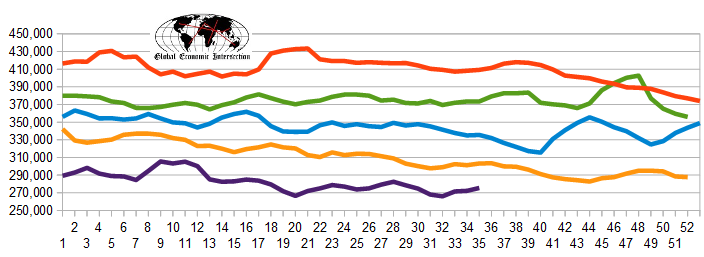
The market was expecting the weekly initial unemployment claims at 268,000 to 278,000 (consensus 273,000) vs the 282,000 reported. The more important (because of the volatility in the weekly reported claims and seasonality errors in adjusting the data) 4 week moving average moved from 272,250 (reported last week as 272,500) to 275,500. The rolling averages generally have been equal to or under 300,000 since August 2014.
Weekly Initial Unemployment Claims - 4 Week Average - Seasonally Adjusted - 2011 (red line), 2012 (green line), 2013 (blue line), 2014 (orange line), 2015 (violet line)
Bankruptcies this Week: Privately-held Bunkers International, Armada Oil
Click here to view the scorecard table below with active hyperlinks
