Market bulls finally have something to talk about.
Last week, the S&P 500 and the Nasdaq Composite Index both posted their first positive weeks of the year.
Of course, the benchmarks have a long way to go before the optimists can truly jump for joy – both indices are down about 7% in 2016.
And what about the third major index, the Dow Jones Industrial Average (DJIA)?
Today, we’re going to take a closer look at this critical index for technical traders, as well as two key levels to follow as we head into February.
Inside the Lines
Technical analysis is all about spotting support and resistance and then trading the trend. One of the easiest ways to identify these levels is to draw trend lines.
As I talked about last week, a stock is always trending in one of three directions: up, down, or sideways. Support and resistance trend the same way – and you can sight these levels by drawing them on a chart.
The DJIA marked its 52-week high on May 20, 2015. Since then, the average has made lower highs as it moves forward.

As you can see, the line indicates clearly defined resistance in a distinct downtrend pattern. The price hasn’t been able to penetrate this line to the upside for the last six months.
However, if we zoom out a few years, we can see a clear support line from the lows in February 2014, August 2015, and the recent low in January 2016.

This tells us that the DJIA’s long-term uptrend is still intact, which is very good news for the bulls.
Fibonacci at Work
Since marking its 52-week high, the Dow has fallen 12%. This places the index in what traders call correction territory – a decline of 10% from a previous high.
The index has been in this bearish zone for the last two weeks, and until last week, it struggled to regain momentum.
But strong earnings reports from constituents 3M Company (N:MMM) and McDonald`s Corporation (N:MCD), as well as the prospect of a bottom in oil, have provided the Dow Jones with a hefty boost to the upside.
Let’s take a closer look at the price action. On Wednesday, the index closed above a key technical level for bulls.
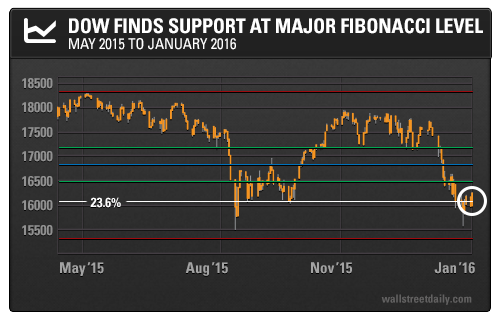
A Fibonacci retracement is depicted above, plotted between the intraday high on May 20, 2015 and the intraday “flash crash” low on August 24, 2015.
Using a recent high and low point, Fibonacci retracements provide traders with several lines of potential support and resistance.
As you can see, in addition to a solid bounce off the two-year trend line, the index also found support at the 23.6% line.
This line represented crucial support in the bullish October rally off the September “biotech crash” lows. The DJIA shot up 10% from this level to its November peak.
Basically, if the Dow Jones can hold these levels, we could be looking at a major rally as technical traders rush in.
On the hunt,