Get 40% Off
⚠ Earnings Alert! Which stocks are poised to surge?
See the stocks on our ProPicks radar. These strategies gained 19.7% year-to-date.
Unlock full list

The Technical State Of Natural Gas

Published 09/19/2016, 11:47 AM
Updated 07/09/2023, 06:31 AM

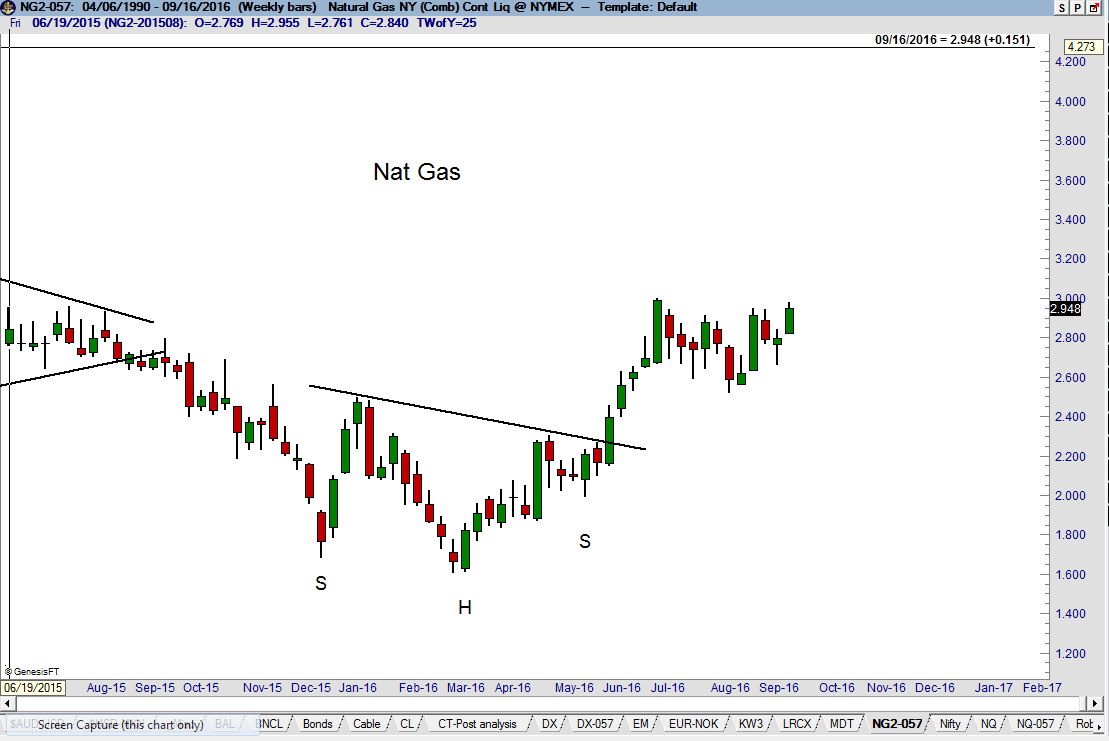
I last covered the natural gas market back on June 20. Natural gas posted a 21-year price low in Mar. 2016 and the bottom took the form of a 7-month natural gas head-and-shoulders bottom on the daily and weekly charts. The target of this H&S at 2.934 was quickly met on Jun. 29.

Weekly Natural Gas

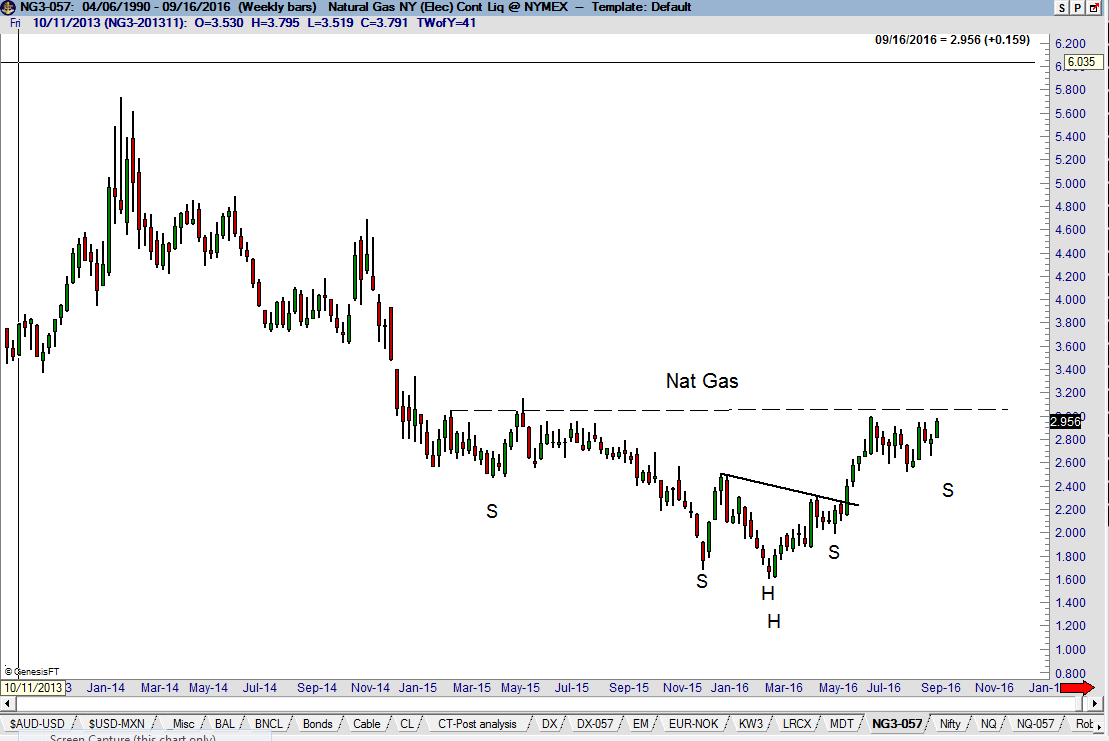
A case can now be made that the weekly chart is forming a 21-month natural gas head-and-shoulders bottom, as shown below. I have some significant issues with this interpretation. One problem is that the right shoulder is too abbreviated in relationship to the left shoulder. A second problem is that there is no overlap between the two shoulders on the charts of the individual contract months (not shown).

Weekly Natural Gas

I prefer to view the period since July 1 as simply an 11-week consolidation within a primary bull trend. A decisive close above 3.091 (Nov. contract) would complete this consolidation and establish 3.433 as the next target level.
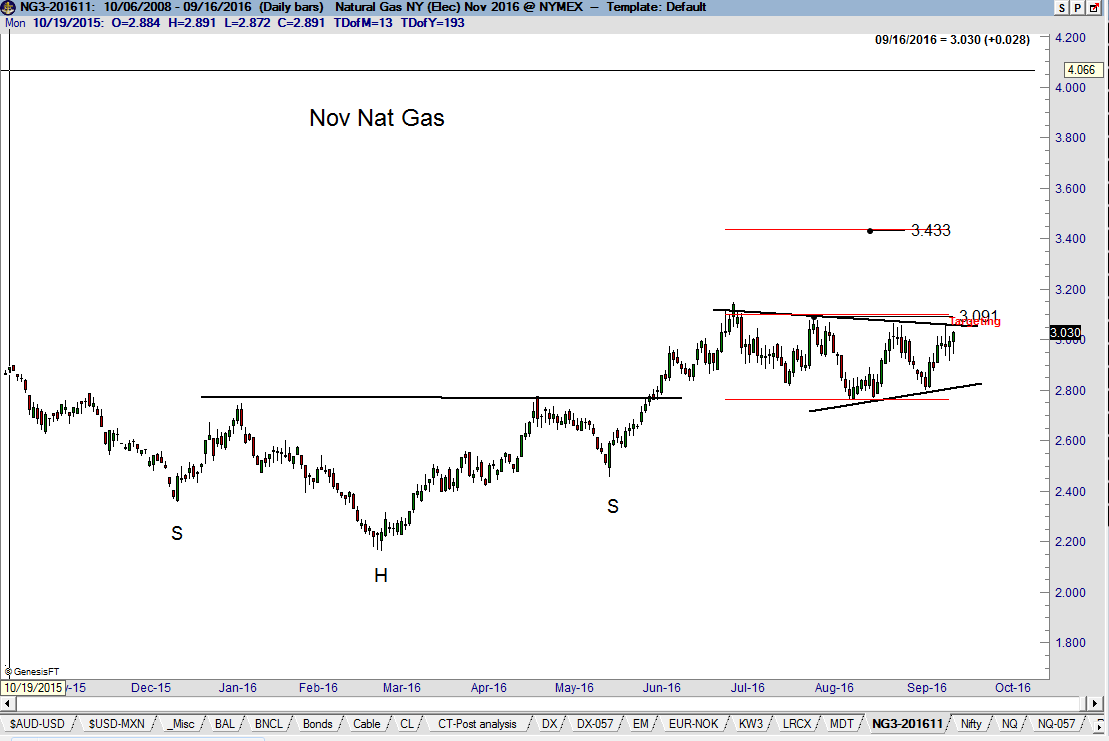
Daily Natural Gas

The United States Natural Gas ETF (NYSE:UNG) displays a very clear 10-month H&S bottom.
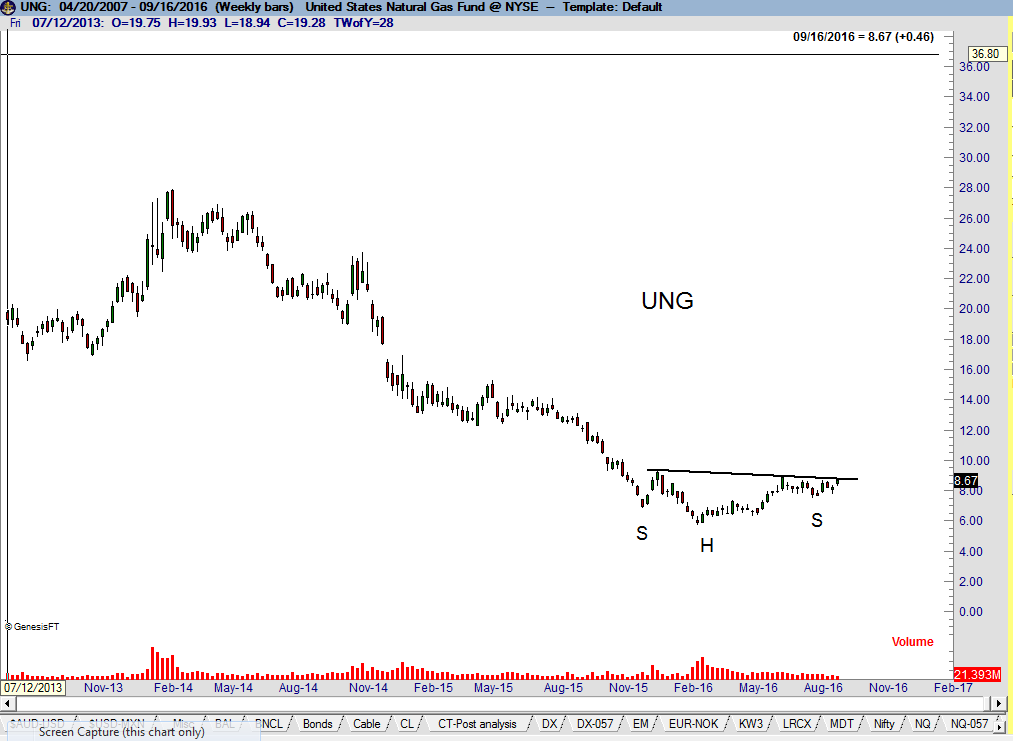
Weekly United States Natural Gas ETF

Investors who attempted to buy the natural gas market with UNG lost money continually from Jul. 2008 through May 2012, despite periodic rallies in the underlying product. UNG was a terrible investment vehicle due to the large carrying charge structure of the futures market. However, the huge carrying charges have disappeared in nat gas. As the chart below shows, Dec 2017 contract has gone from nearly five full points carry to the near contract to almost even money. The one-year carrying charge in nat gas (Dec. 2016 to Dec. 2017) is currently only .05. Thus, the carrying charge disincentive to own UNG has all but disappeared, making UNG a legitimate play.
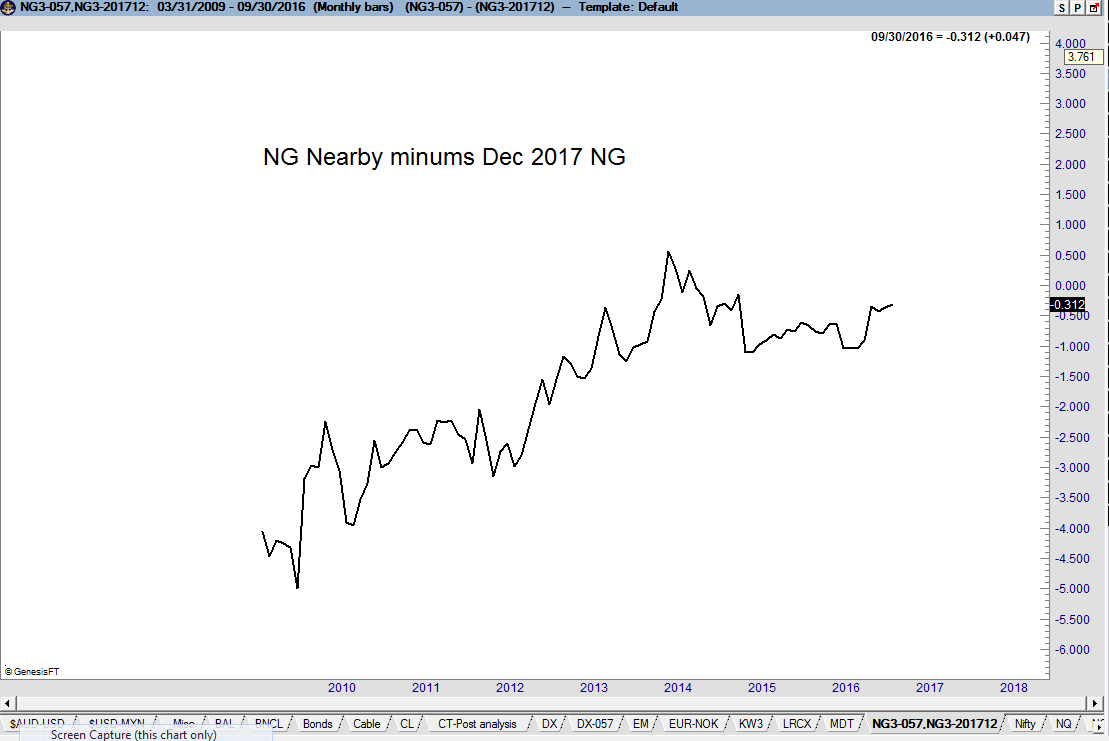
Monthly Natural Gas

The daily graph of UNG displays a 12-week continuation inverted H&S with a horizontal neckline at 8.69. Using the 3% breakout rule of Edwards and Magee, a close above 8.95 in expanded volume would be a valid breakout in UNG.
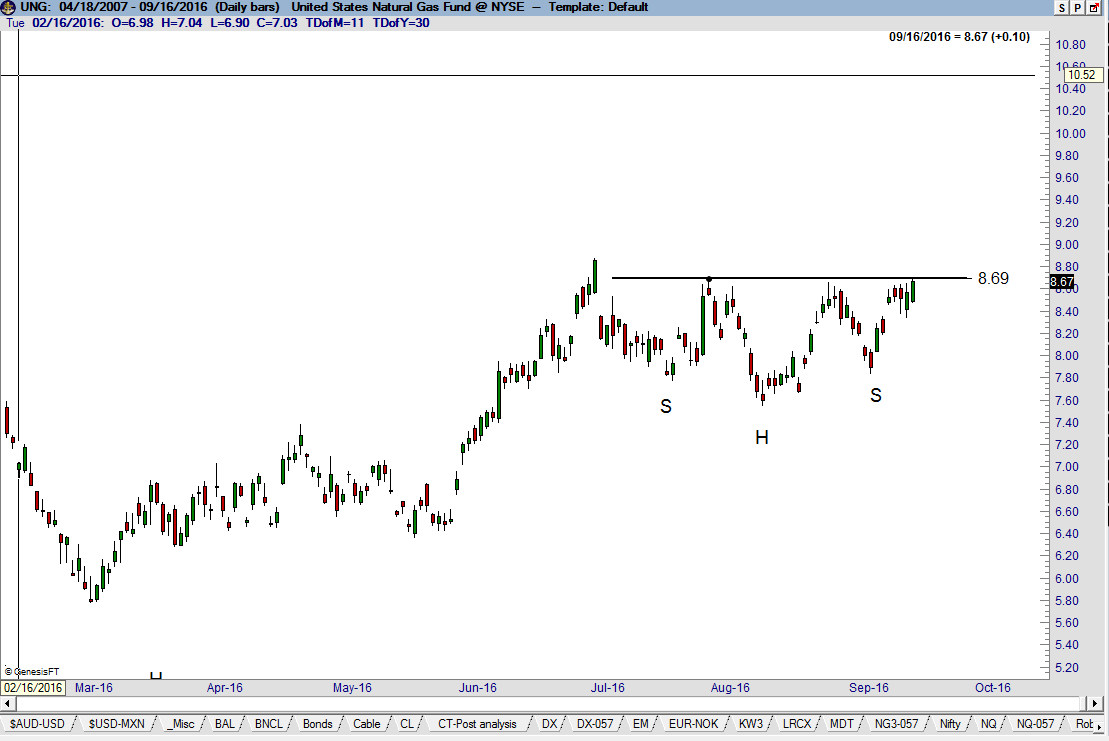
Daily United States Natural Gas ETF

Latest comments

Risk Disclosure: Trading in financial instruments and/or cryptocurrencies involves high risks including the risk of losing some, or all, of your investment amount, and may not be suitable for all investors. Prices of cryptocurrencies are extremely volatile and may be affected by external factors such as financial, regulatory or political events. Trading on margin increases the financial risks.
Before deciding to trade in financial instrument or cryptocurrencies you should be fully informed of the risks and costs associated with trading the financial markets, carefully consider your investment objectives, level of experience, and risk appetite, and seek professional advice where needed.
Fusion Media would like to remind you that the data contained in this website is not necessarily real-time nor accurate. The data and prices on the website are not necessarily provided by any market or exchange, but may be provided by market makers, and so prices may not be accurate and may differ from the actual price at any given market, meaning prices are indicative and not appropriate for trading purposes. Fusion Media and any provider of the data contained in this website will not accept liability for any loss or damage as a result of your trading, or your reliance on the information contained within this website.
It is prohibited to use, store, reproduce, display, modify, transmit or distribute the data contained in this website without the explicit prior written permission of Fusion Media and/or the data provider. All intellectual property rights are reserved by the providers and/or the exchange providing the data contained in this website.
Fusion Media may be compensated by the advertisers that appear on the website, based on your interaction with the advertisements or advertisers.
© 2007-2024 - Fusion Media Limited. All Rights Reserved.