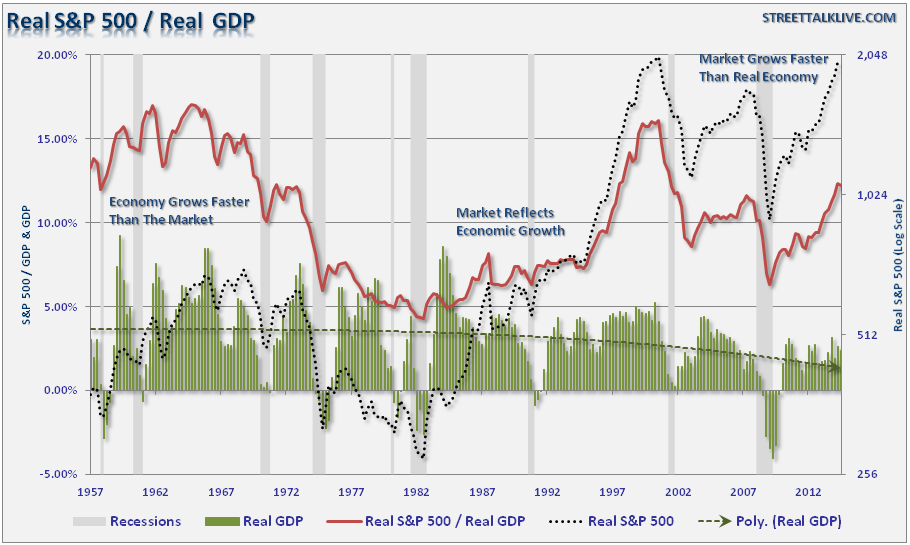
Think about this for a moment. The stock market is comprised of thousands of companies doing business in the economy. Therefore, it only makes sense that the value of the stock market should be a reflection of the economy. As the economy ebbs and flows, so should the values of the companies that are operating within it. This idea can be demonstrated by looking at the real, inflation-adjusted, price of the S&P 500 as a percentage of real GDP.
From 1960 through 1980 the economy was growing faster than asset prices as the U.S. was the manufacturing powerhouse of the post-WWII industrialized nations. However, beginning in 1982 the economy begin to shift from a production and manufacturing-based society to a service based economy with finance at the core. As interest rates and inflation began a 30-year decline, the demand for credit rose to offset a rising standard of living that outpaced both economic and wage growth. Between 1982 and 2000 the price of the market caught up with, and eventually surpassed, real economic growth.
Following the turn of the century, prices have continued to push higher as continued declines in inflationary pressures and interest rates were enhanced by sequential floods of liquidity from mortgage equity extractions, easy credit terms and recently direct injections from the Federal Reserve. Since 2000, the price of the market has far outpaced the growth of the underlying economy.
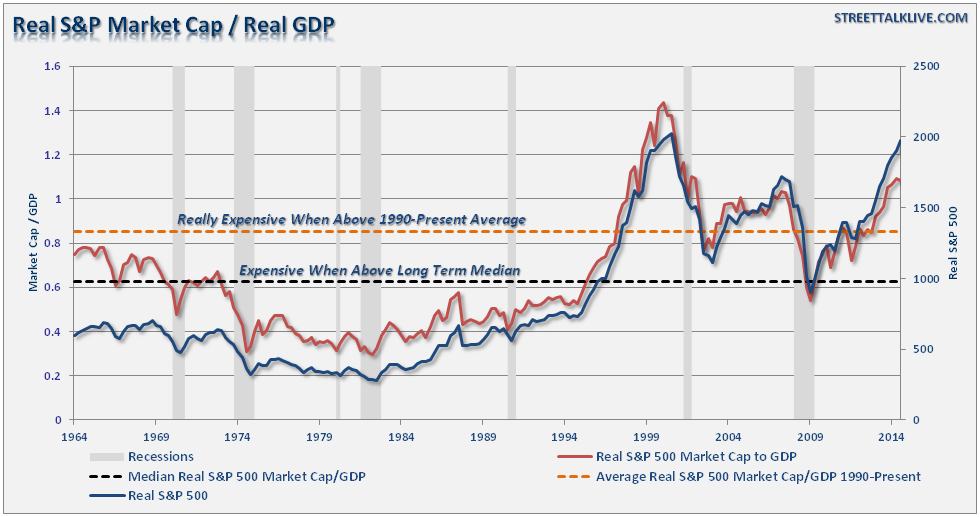
Another way to look at this phenomenon is by using the inflation-adjusted market capitalization of the S&P 500 Index (price times the number of shares outstanding) as a percentage of real GDP.
You can see it again here. Prior to 1990, the price of the market was more of a reflection of real economic growth rather than financial engineering. However, since 2009 the price of the market has far outpaced real underlying economic growth to an extent greater than what was witnessed at the peak of the last two market "bubbles."
[Note: It has been clearly stated by the majority of mainstream economists and analysts that the market is currently "NOT" in a bubble. While that may be the case, it is worth remembering that is what was also said at the peak of the last two major market cycles that were eventually called "bubbles" in hindsight.]
Over the last decade in particular, financial engineering has distorted the relationship between the financial markets and the underlying economy. Corporations have resorted to a host of tools to maintain asset prices in the face of weak economic growth. To wit:
"In order for profitability to surge, despite rather weak revenue growth, corporations have resorted to four primary weapons: wage reduction, productivity increases, labor suppression and stock buybacks. The problem is that each of these tools create a mirage of corporate profitability."
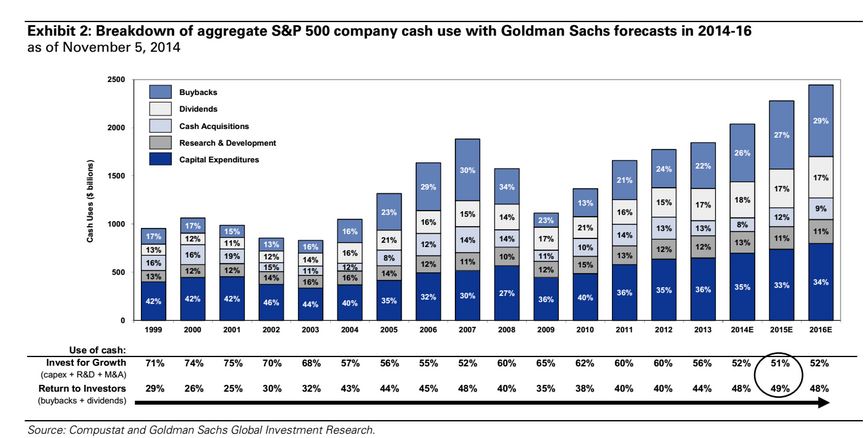
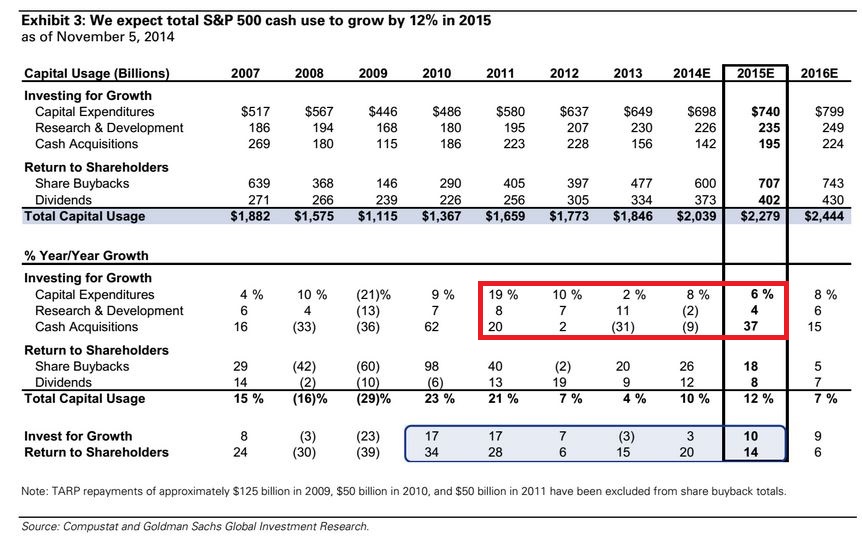
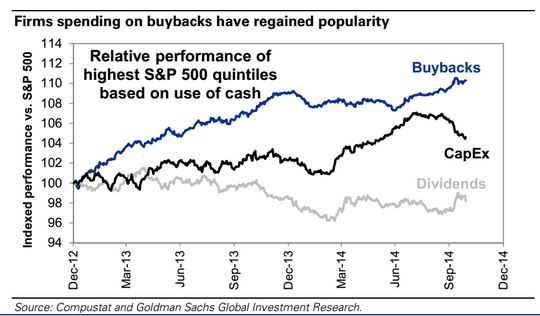
This point was reiterated recently by Goldman Sachs (NYSE:GS) in a recent report where they estimated that cash spending by companies in the S&P 500 index will increase by 12% to $2.3 Trillion in 2015. Of that increase in spending 51% will be used for spending and 49% will be returned to shareholders.
The analysts estimate that S&P 500 companies will put around $740 billion into capital expenditures next year alone. This is roughly a 6% growth rate in Capex down from 8% in 2014. This decline in capex spending is going to disappoint market bulls who have been anxiously awaiting the revival of massive capex spending as companies ramp up to meet burgeoning consumer demand.
The problem, however, continues to be a lack of demand follow through to justify further increases in capital expenditures. With oil prices falling due to global demand pressures, the resurgence in capex will likely be put on hold for another year as the energy sector makes up roughly one-quarter of the total S&P 500 capex and R&D spending.
The problem for the "economic growth is coming" crowd is that corporations are indeed spending their cash, but not in ways that directly impact economic growth like capex and R&D does.
It is estimated that in 2015 companies will increase cash used for acquisitions by 37%, which generally results in layoffs and consolidations, 31% of the budgeted cash will be used for "stock buybacks," up from 29.4% in 2014, and 17.6% will be distributed to shareholders as dividends which is down from 18.2% in 2014.
Since dividends flow primarily to the top 20% of the country that have assets invested in the markets, there will be very little impact from the distribution of dividends to shareholders on economic growth. Stock buybacks boost earnings per share reports which supports assets prices, but again has very little impact on the 80% of the economy has little or no money invested in the financial markets. (Read: For 90% of America, There Has Been No Recovery for supporting evidence to the statement above.)
The analysts at Goldman Sachs noted that stock buyback trends have resumed over the past several months. They state:
“The slow pace of recovery and recurring threat of economic stagnation has biased managements in recent years toward returning cash to shareholders. Although we expect a gradual shift toward investing for growth via capital expenditures and M&A as confidence in the U.S. economy grows, the popularity of dividends and buyback should continue…”
The next chart shows the real problem for the economic growth bulls in the quarters ahead.
First, it is important to understand that capital expenditures by corporations can not offset any significant drag in personal consumption expenditures which comprises almost 70% of economic growth. Secondly, capital expenditures are a function of aggregate end demand. Therefore, if the personal consumption expenditures slow the demand for increased levels of capital expenditures by businesses will also wane.
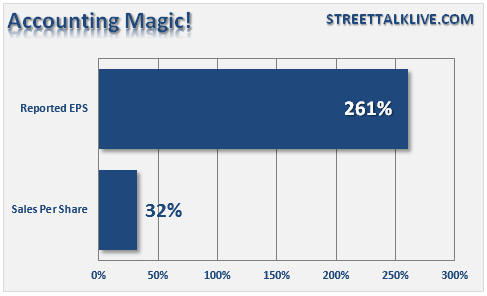
Lastly, topline revenue growth remains extremely weak since the end of the last recession. As shown in the chart below revenue per share has increased by a total of 32% from 2009 through the second quarter of 2014 while reported earnings per share has exploded by 261%. This has been due to the near record level of companies buying back shares to artificially boost profitability.
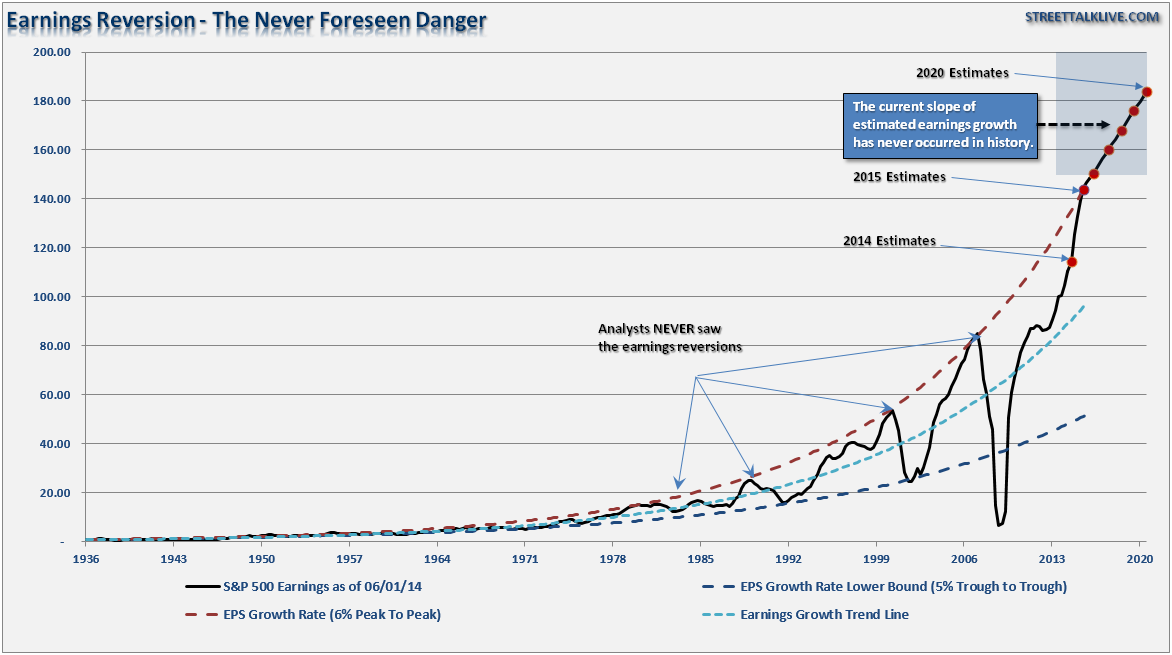
The problem with this activity, along with cost cutting, employment reductions and other measures to increase profitability, is that they are all finite in nature. Eventually, either revenue growth must accelerate, or earnings are at risk of a significant disappointment. As shown in the chart below, earnings have never attained the currently expected growth rate...ever.
The recent mid-term elections sent a very clear message to Washington, D.C., which was simply "the economy sucks." While statistical economic data suggests that the economy is rapidly healing, it has only been so for a very small percentage of the players. For most American's they have only watched the "rich" prosper as the Federal Reserve put Wall Street before Main Street. Stock buybacks, dividends and acquisitions are great for those that have money invested in the financial markets, however, for the rest of America it is only a spectator sport.
The risk to the markets currently is that the wave of deflationary pressures engulfing the globe have only begun to wash back on the domestic economy. The drag on exports, combined with the potential for extremely cold winter weather, puts both economic and earnings growth rate projections at risk. With the markets in extremely overvalued territory, the risks to investors clearly outweigh the rewards over the long-term.

