Upcoming US Events for Today:
- Consumer Price Index for March will be released at 8:30am. The market expects a month-over-month increase of 0.1%, consistent with the previous report. Less Food and Energy, CPI is expected to show the same 0.1% increase, again consistent with the previous report.
- Empire Manufacturing Index for April will be released at 8:30am. The market expects 7.50 versus 5.61 previous.
- Housing Market Index for April will be released at 10:00am. The market expects 49 versus 47 previous.
Upcoming International Events for Today:
- Great Britain CPI for March will be released at 4:30am EST. The market expects a year-over-year increase of 1.6% versus an increase of 1.7% previous.
- Euro-Zone Trade Balance for February will be released at 5:00am EST. The market expects a seasonally adjusted 15.0B versus 14.1B previous.
- German ZEW Survey for April will be released at 5:00am EST. The market expects the survey of Current Conditions to show 51.0 versus 51.3 previous. The survey of Business Expectations is expected to show 45.0 versus 46.6 previous.
- Canadian Manufacturing Shipments for February will be released at 8:30am EST. The market expects a month-over-month increase of 1% versus an increase of 1.5% previous.
- Canadian Existing Home Sales for March will be released at 9:00am EST.
- China GDP for the first quarter will be released at 10:00pm EST. The market expects a year-over-year increase of 7.3% versus an increase of 7.8% previous.
- China Industrial Production for March will be released at 10:00pm EST. The market expects a year-over-year increase of 8.8% versus an increase of 8.6% previous.
- China Retail Sales for March will be released at 10:00pm EST. The market expects a year-over-year increase of 12.1% versus an increase f 11.8% previous.
The Markets
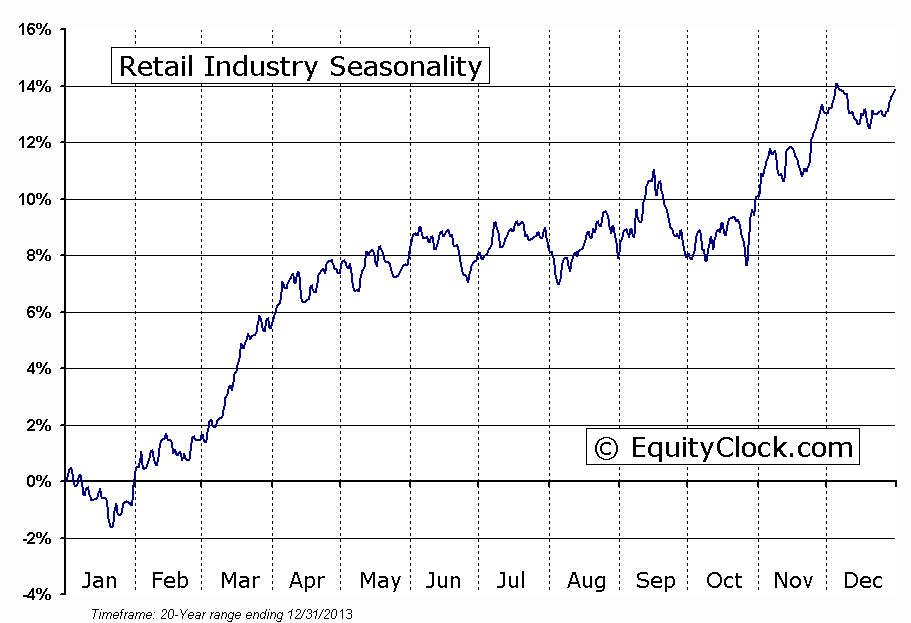
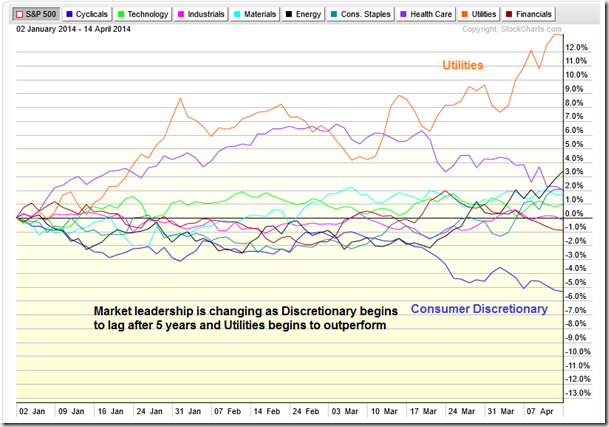
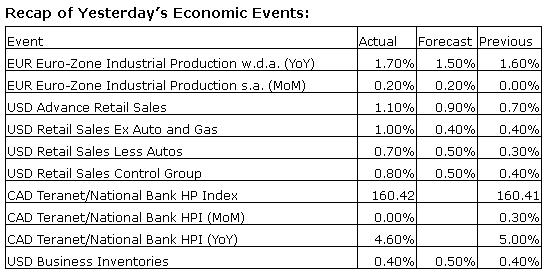
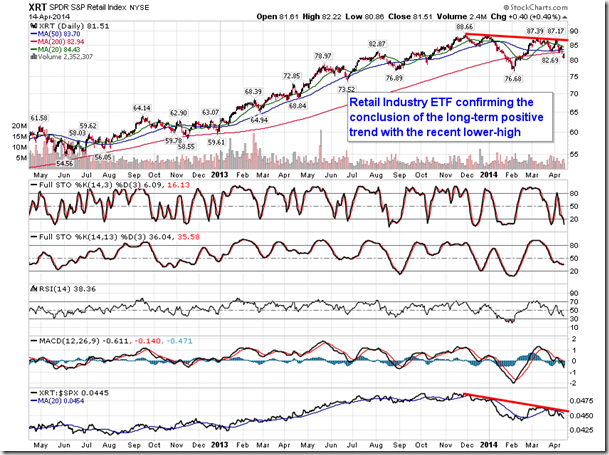
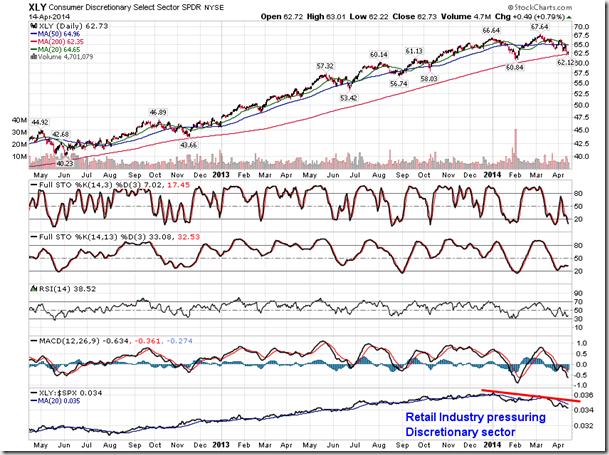
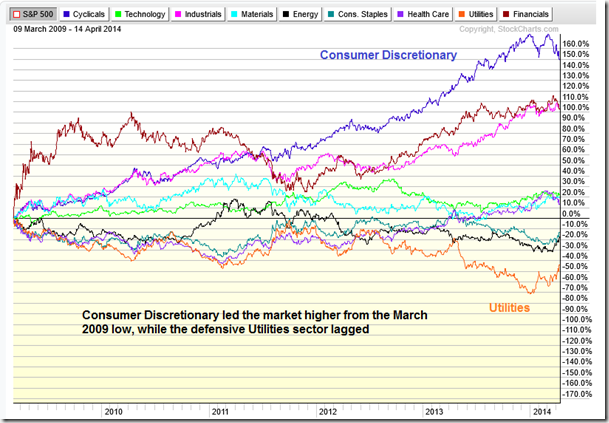
Stocks amounted a bit of a comeback on Monday following a better than expected earnings report from Citigroup Inc (NYSE:C) and an improved report on retail sales for the month of March. Sales are reported to have increased by 1.1% last month, beating estimates calling for an increase of 1.0%. February’s result was also revised upward to an increase of 0.7% versus the prior reading of an increase of 0.3%. It appears that the spring rebound following the colder than average winter is becoming reality; unfortunately, investors remain very sceptical of the stocks within the industry. Following the conclusion of the last period of seasonal strength for the industry in November, retail stocks have struggled, even through the recent period of seasonal strength, which typically runs from late January to early April. The colder than average weather was certainly one factor, pressuring the stocks in the industry to the lows of the year by the end of January. The subsequent rebound failed to attract the strength that is typical for the period of seasonal strength that runs from the end of January through to the beginning of April. Looking at the Retail Industry ETF, a lower significant high was charted below the November/December peak, confirming the end of the positive long-term trend that spanned from October of 2012 to the end of 2013. The industry continues to struggle versus the S&P 500 index. The result has put pressure on the broad consumer discretionary sector, which has shown similar struggle versus broad market benchmarks, the worst performing sector year-to-date. Investors are rotating out of the now overvalued winners, such as discretionary, and reallocating towards stocks with better value. The consumer discretionary sector led the market higher from the March 2009 low, producing returns that vastly outperformed all other sectors. With the market losing its leadership group from the past five years, the sustainability of the strong uncorrected broad market trend that has been realized over the past few years comes into question. Taking the place of market leader is the defensive utilities sector, which has been the top performer year-to-date; utilities has been the weakest performer of the 9 GICS sectors since the March 2009 low.
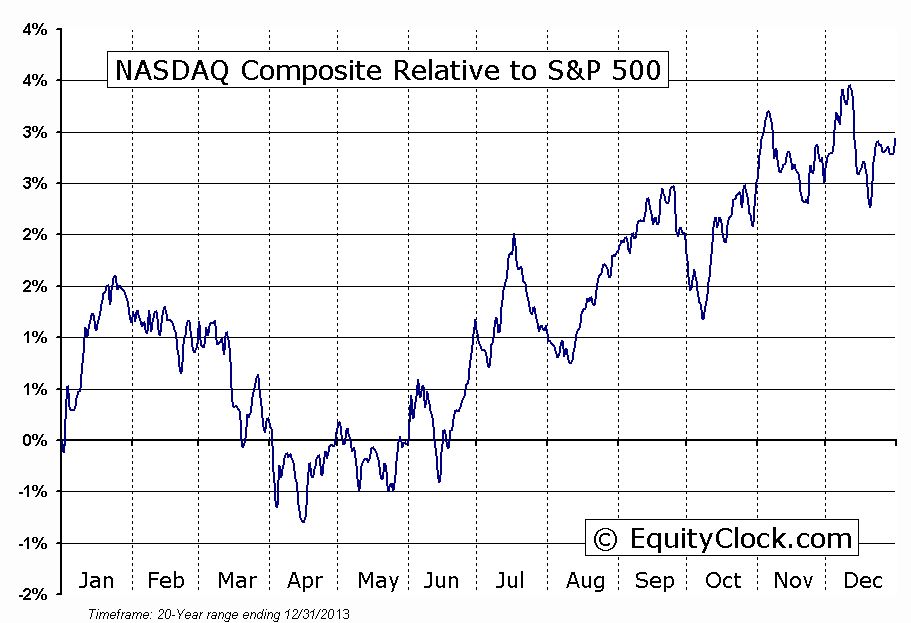
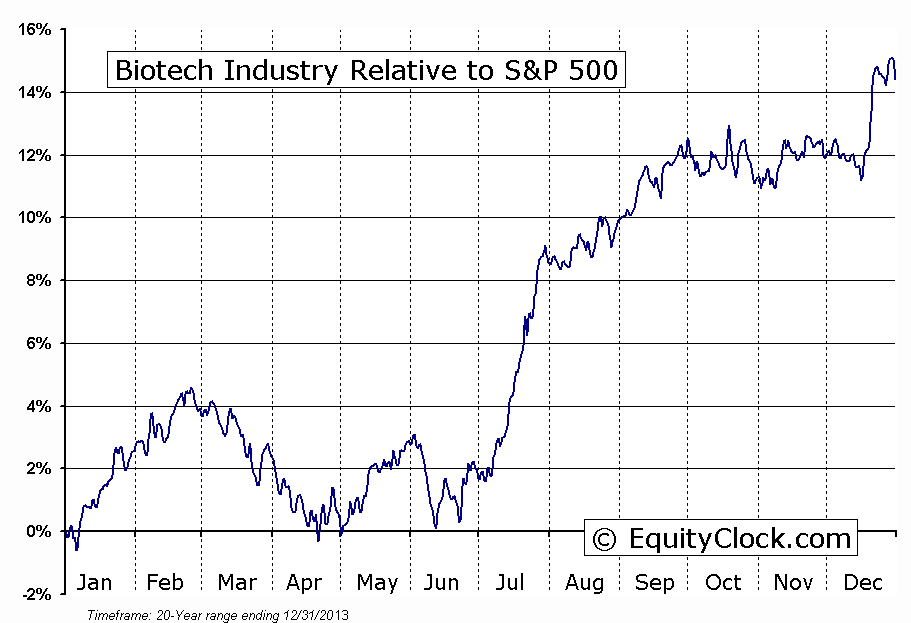
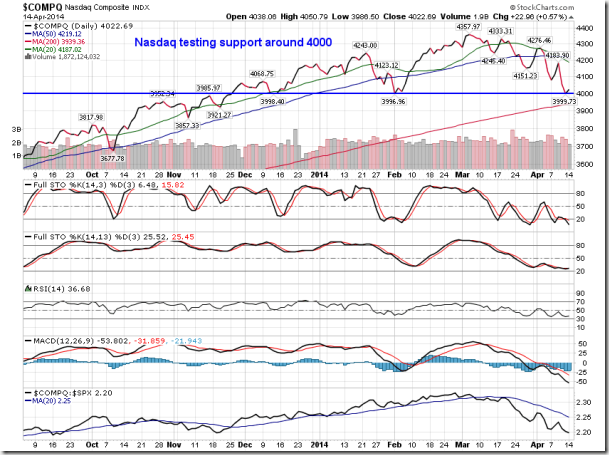
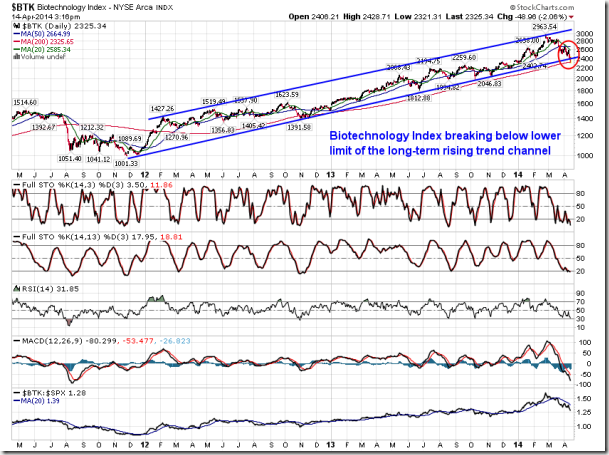
Turning to the equity benchmark that continues to make headlines, the Nasdaq came down and tested a key level of support around 4000 on Monday; a break below this level would trigger further technical selling pressures. The technology heavy benchmark has been under pressure since the start of March as a result of weakness in the biotechnology industry over the same period; the biotechnology index is testing the lower limit of a long-term rising trend channel, although it did break through this level intraday during an abrupt afternoon decline. Both biotechnology and the Nasdaq are concluding a period of seasonal weakness; strength in each are common through to the end of April. Given the support parameters under each benchmark and the conclusion to the period of seasonal weakness, the best opportunity for each to bounce is now. Declines below support would have negative implications for the benchmarks, as well as the broad market, as the Nasdaq has become representative of the collapse of the growth trade as investors rotate towards value.
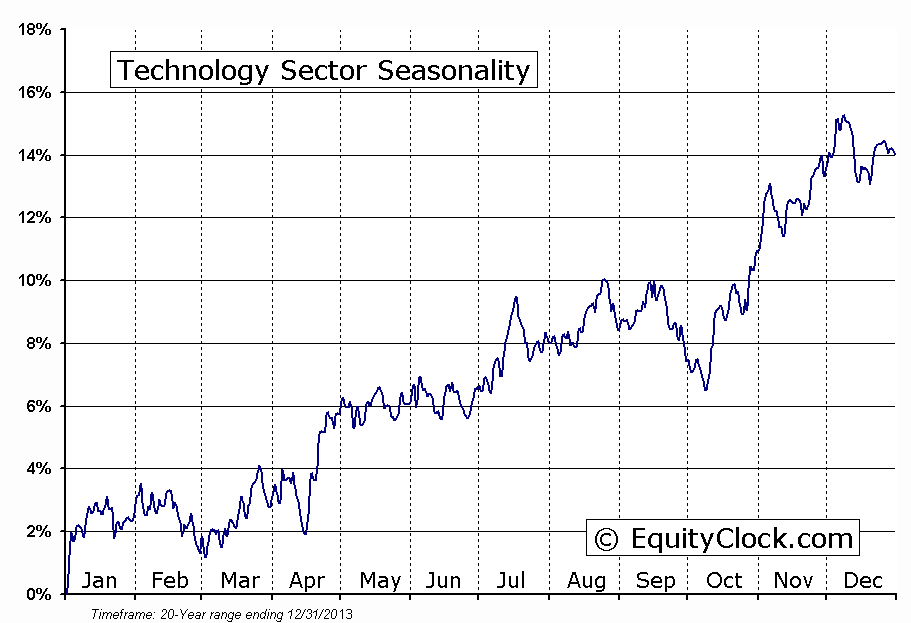
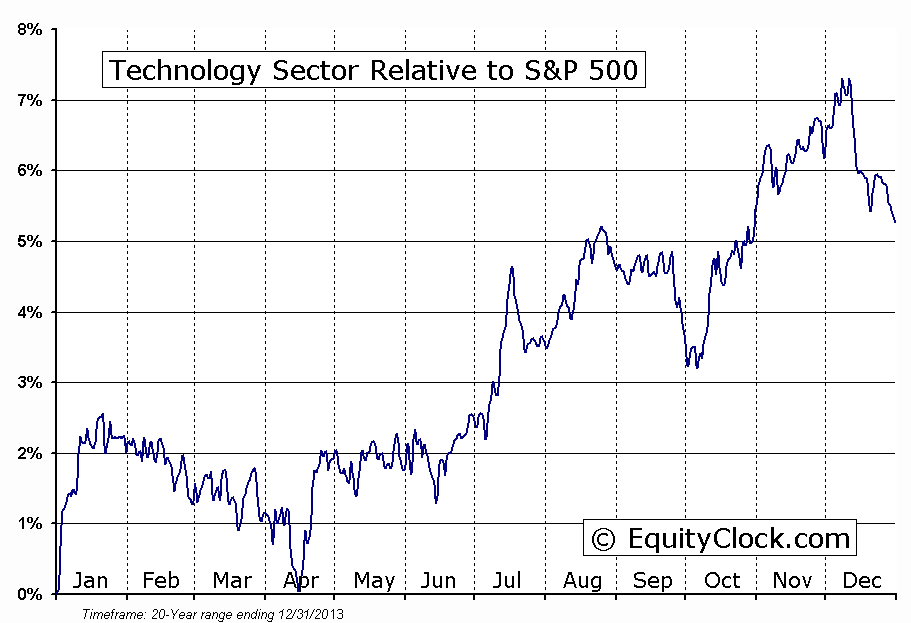
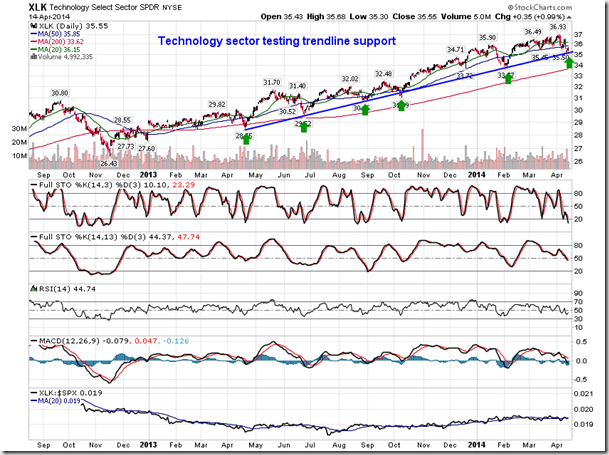
As with the biotechnology industry index, the technology sector is testing important trendline support as it also concludes its period of seasonal weakness and begins a period of seasonal strength that runs through to July. Returns between April 15 through to July 17 average 8.04% based on data from the past 20 years. To read more on this seasonal trade, be sure to read our Globe & Mail titled Four ETFs to tap into the next wave of tech products.
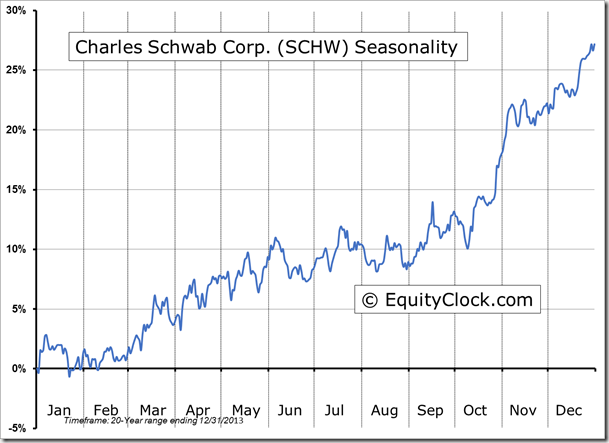
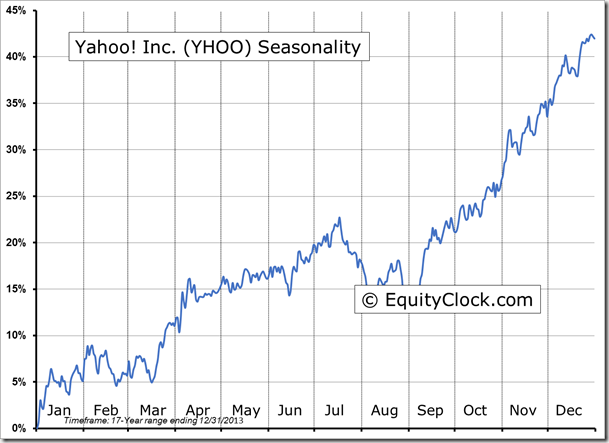
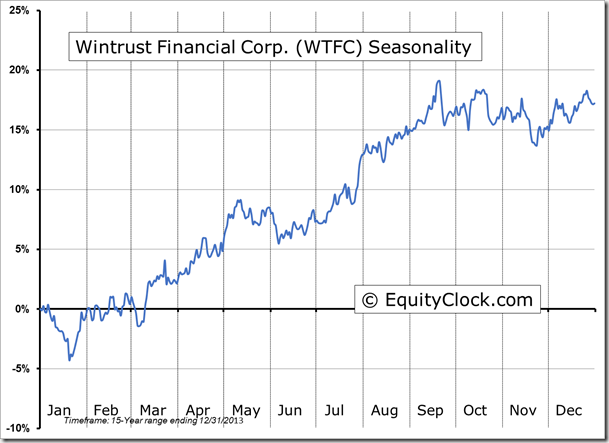
Seasonal charts of companies reporting earnings today:
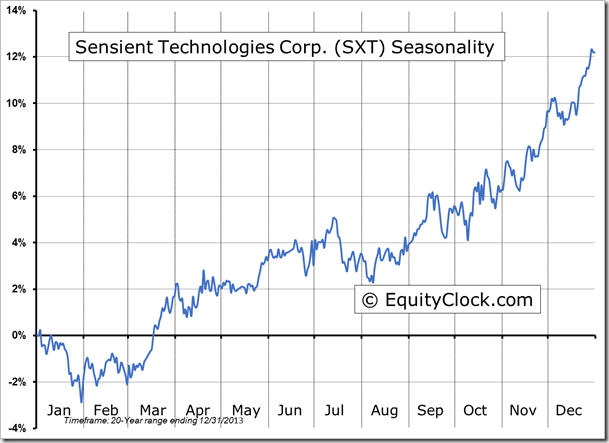
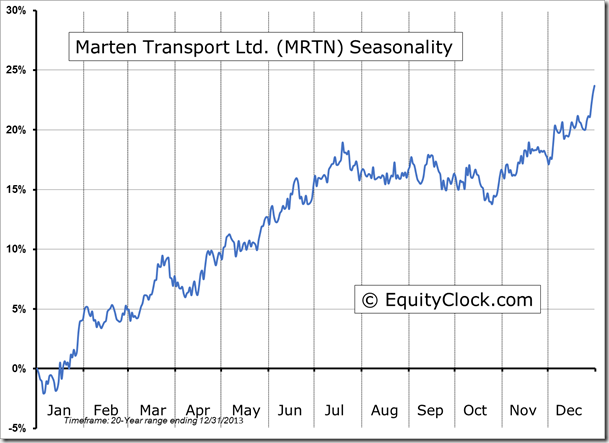
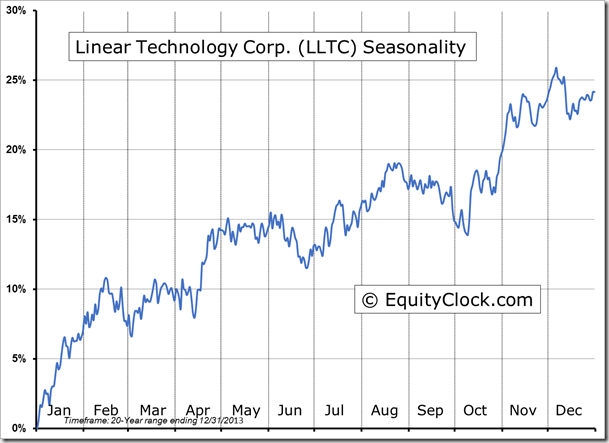
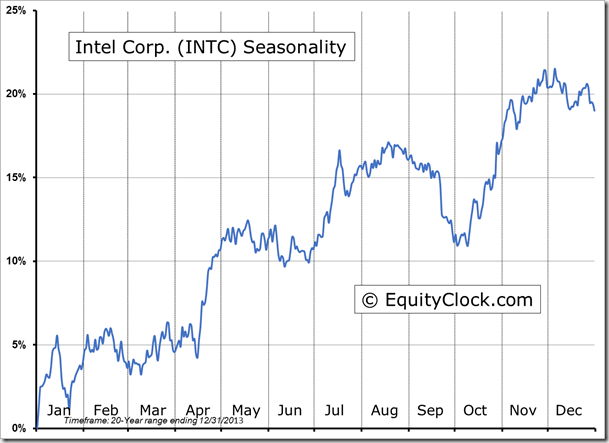
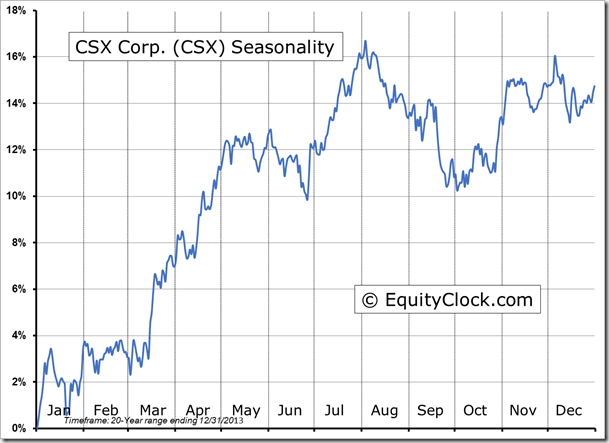
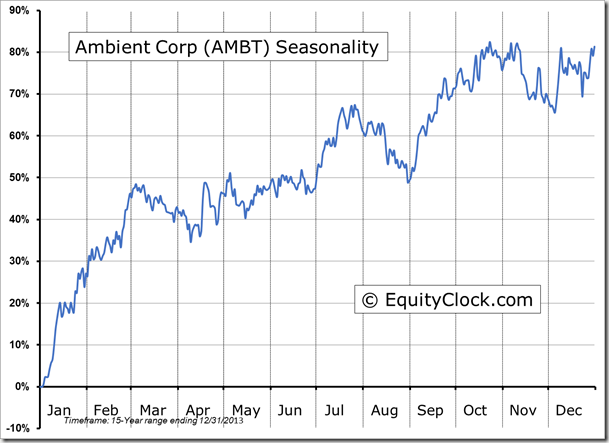
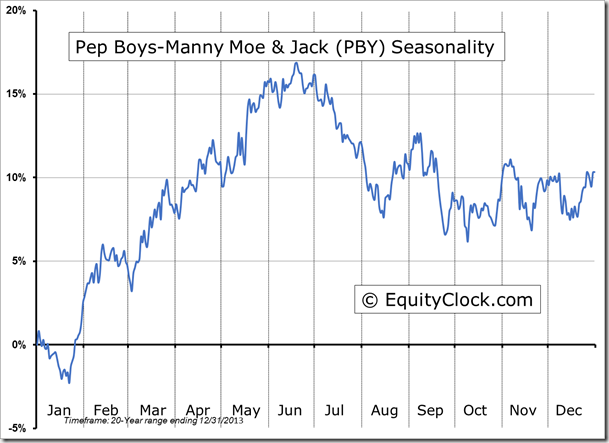
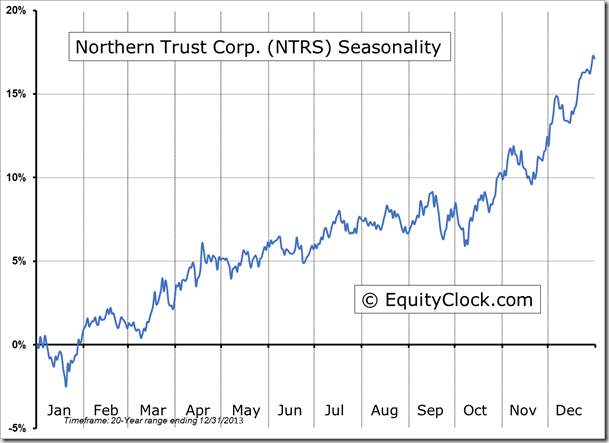
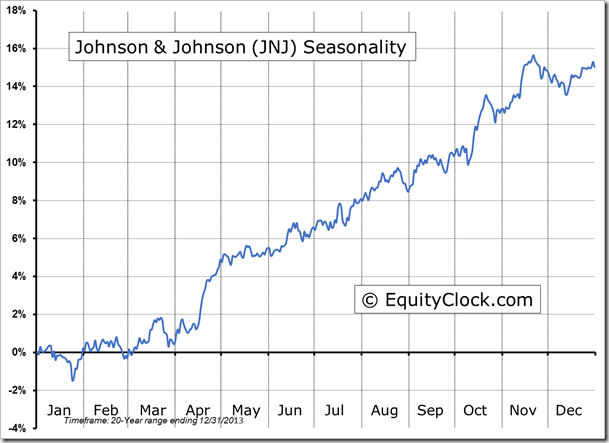
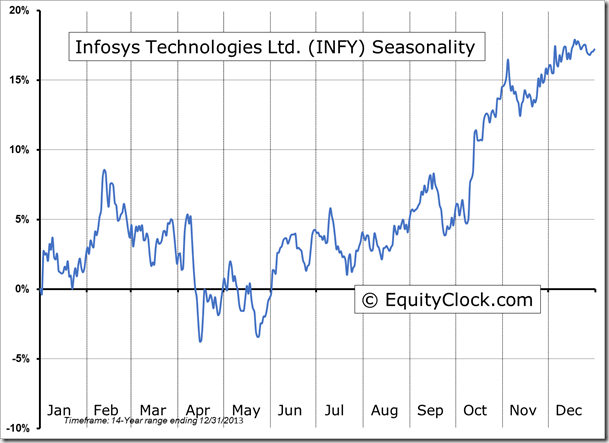
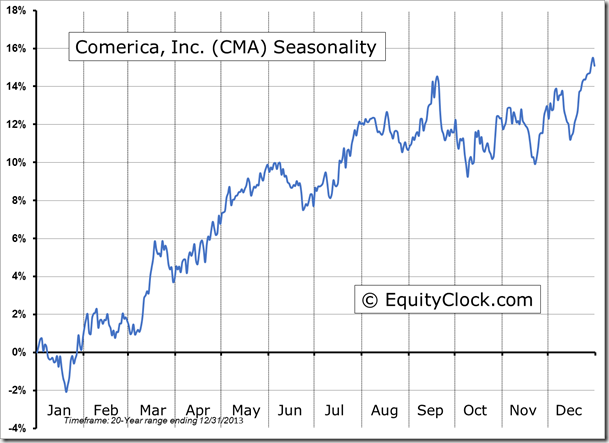
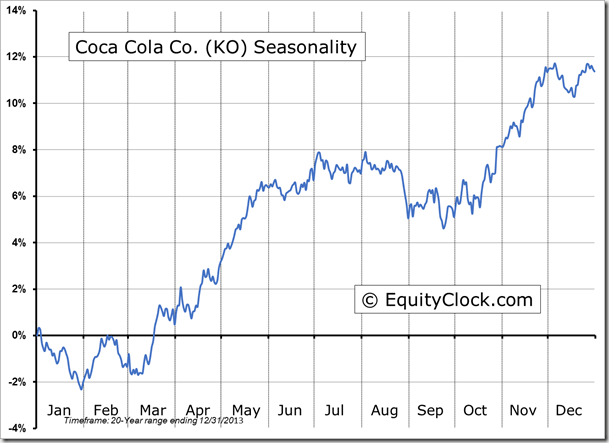
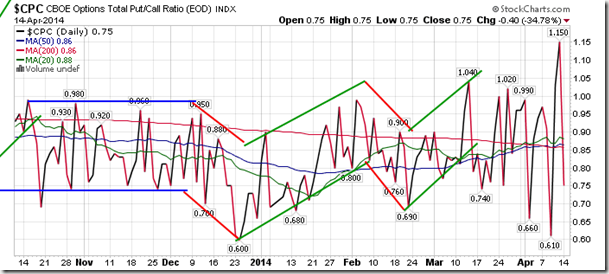
Sentiment on Monday, as gauged by the put-call ratio, ended bullish at 0.75. The range of values in the ratio continue to be extreme, suggesting indecision, typically a negative for stocks.
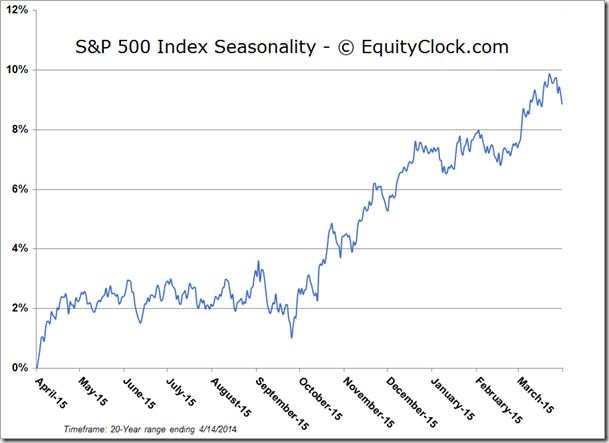
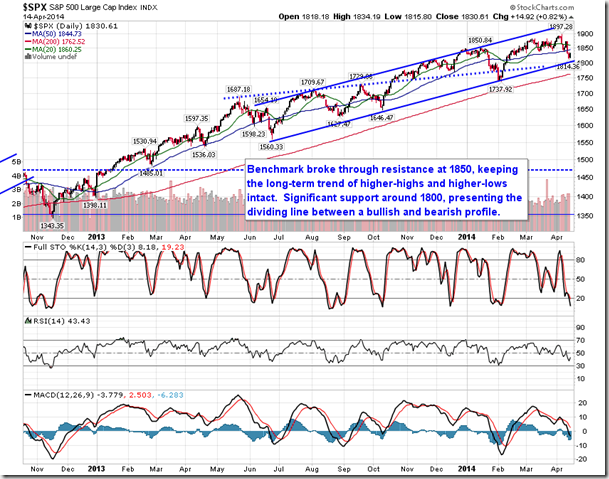
S&P 500 Index
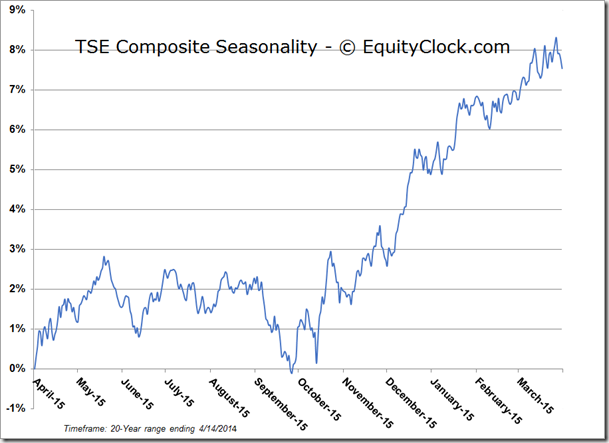
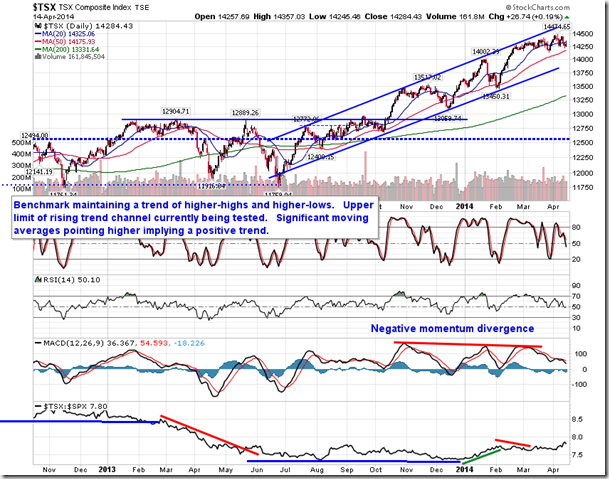
TSE Composite
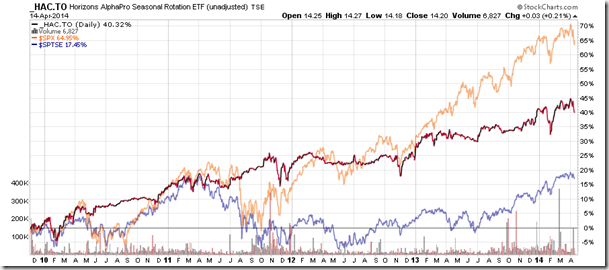
Horizons Seasonal Rotation ETF (HAC.TO)
- Closing Market Value: $14.20 (up 0.21%)
- Closing NAV/Unit: $14.25 (up 0.44%)
Performance*
| 2014 Year-to-Date | Since Inception (Nov 19, 2009) | |
| HAC.TO | -0.35% | 42.5% |
* performance calculated on Closing NAV/Unit as provided by custodian

